What is the volume oscillator?
The volume oscillator is a technical analysis indicator that measures the difference between two moving averages of the volume, according to Fidelity. As a trader, it is important to know the general trend of the stock or security you are trading. So, this indicator will help you achieve this task.
What is the formula of the volume oscillator?
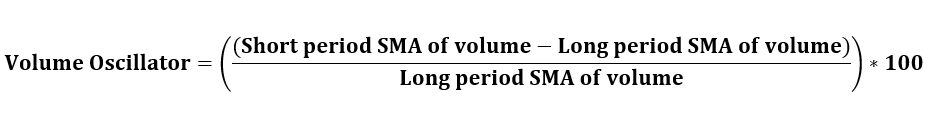
The formula of the volume oscillator is calculated using the short period and long period simple moving averages of the volume.
How does this indicator works?
This indicator uses the short and long periods moving averages of the volume. This indicator oscillates above and below zero depending on the values of the moving averages. Furthermore, the values of the volume oscillator are expressed in percentages.
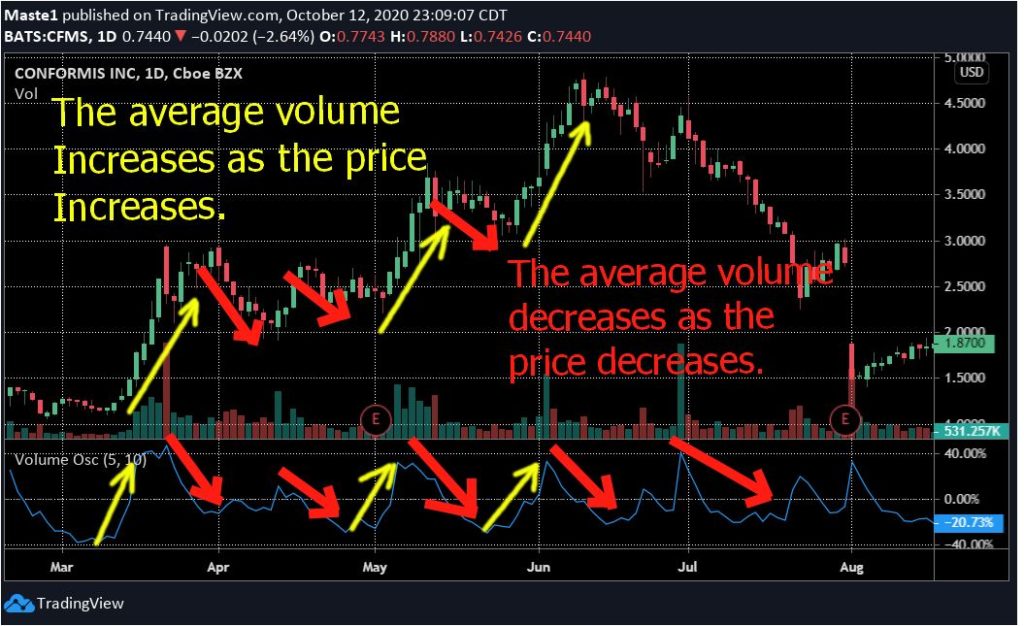
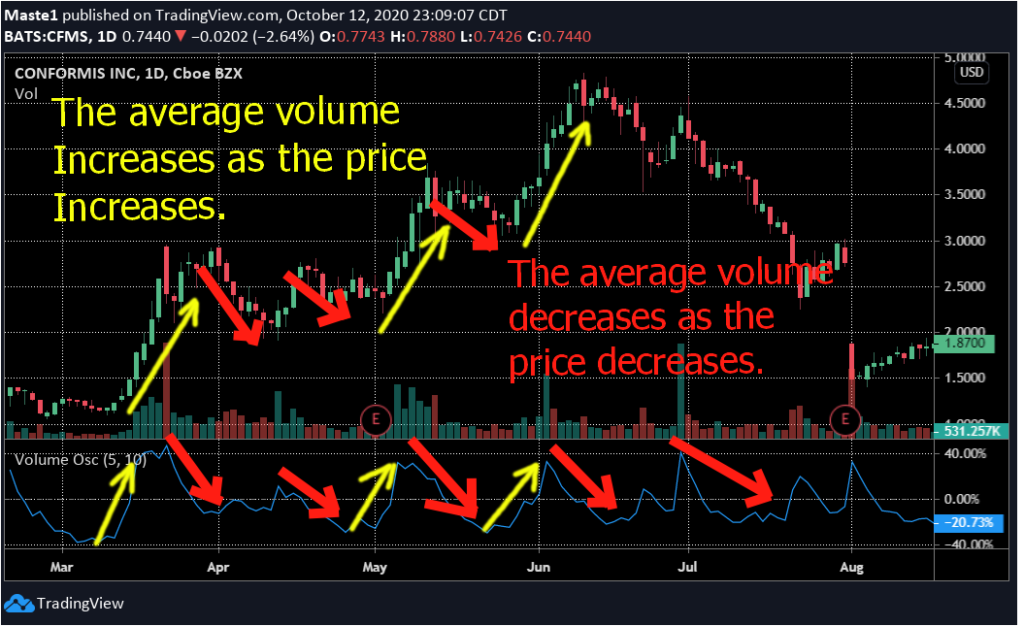
If the shorter-term moving average of the volume moves above the long-term one, the volume oscillator will be positive. From this observation, investors will know that the short-term volume trend is up or positive. In order words, more investors will buy shares of the stock which could cause a rise in the price of the stock.
On the other hand, if the long term moving average of the volume moves above the short-term volume moving average; this indicator will have negative values(will have a downtrend and head below zero). From this information, investors will know that the short term volume trend is down. As a result, the price of the stock that is being traded will have a downtrend. This information will then help investors to know how to invest in the stock.
Benefits of the volume oscillator
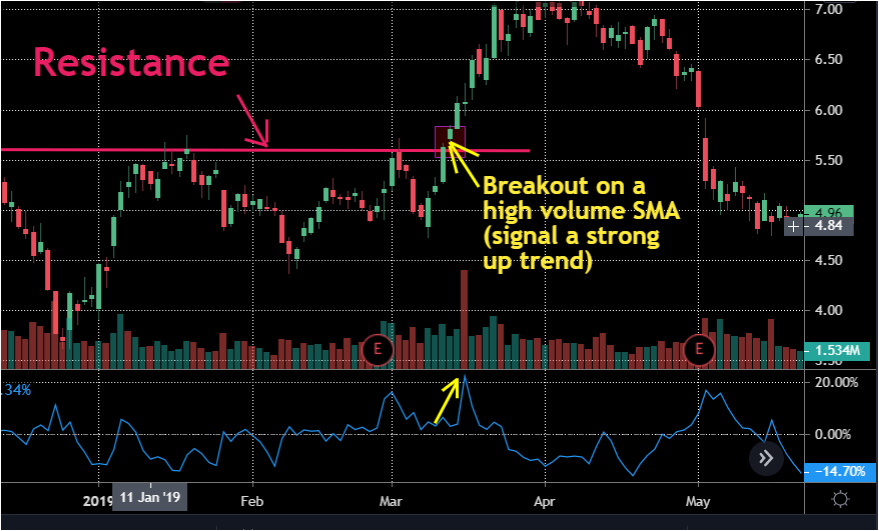
Many traders and investors take positions in stocks and other securities after the break out of patters, support levels, or resistance levels. However, investors need the confirmation of a true breakout. Sometimes, stocks experience false breakouts when there is not enough demand(volume) for the stock’s shares.
For this reason, investors can use the volume oscillator to confirm that a stock has enough volume that supports the breakout and the trend.
This trend can also help you know when to exit a position you already have. If you took a long position, for example, you will need to know when there is a change in volume and price reversal before they happen. This way, you will be able to end your position and lock in a profit before it is too late.