What is awesome oscillator?
The awesome oscillator is a technical analysis indicator that measures the momentum of markets, stocks, and other assets. This indicator compares the recent momentum with overall momentum over a period of time.
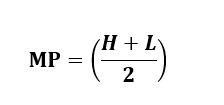
The awesome oscillator uses the comparison between the 5-period simple moving average bars with the 34 period moving average bars, according to Admiral Markets. In order words, the awesome oscillator is the difference between these two moving averages. This indicator uses the mid-points (MP) of each bar to calculate moving averages instead of the closing and opening values.
That is:
AO = (5-period SMA) – (34-period SMA)
Where:
MP = Mid-point
H = High value
L = Low value
AO = Awesome Oscillator
How to use the awesome oscillator?
Investors use awesome oscillator in many ways. However, the main two benefits are the signals to buy and sell. The following are some of the strategies you can use to trade with the awesome oscillator.
- Zero line cross over
- Saucer
- Twin peaks patterns
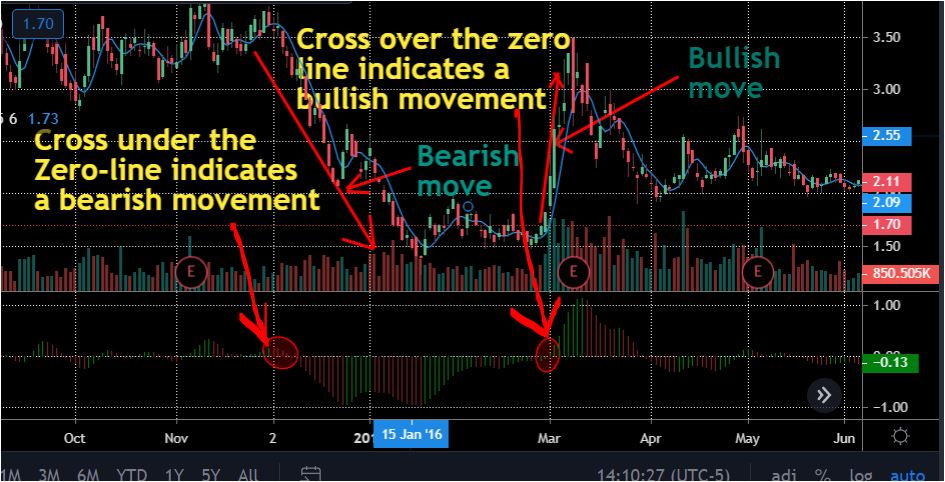
1. Zero line cross over

The zero line acts as a separation between the bullish and bearish areas. If the AO bars cross the zero-line from positive to negative section it will indicate a bearish movement.
On the other hand, if the bars cross the zero-line from negative to positive, it will indicate a bullish movement.
Note: When trading, never rely on a single indicator. This is because random news or panic in the market can cause prices to behave differently. As are a result, investors can be tempted to make wrong investment decisions. To avoid making wrong decisions, use a combination of multiple indicators. If all indicators are leading to the same conclusion, you are probably making the right investment choice.
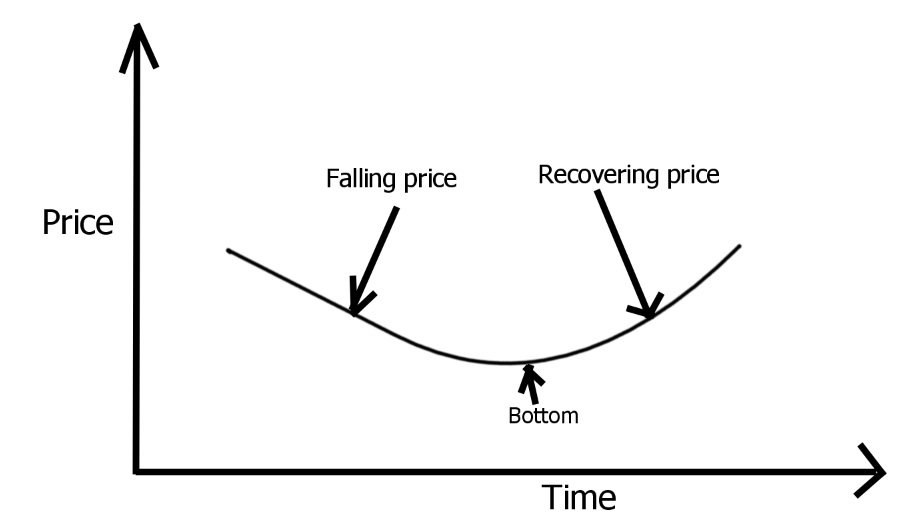
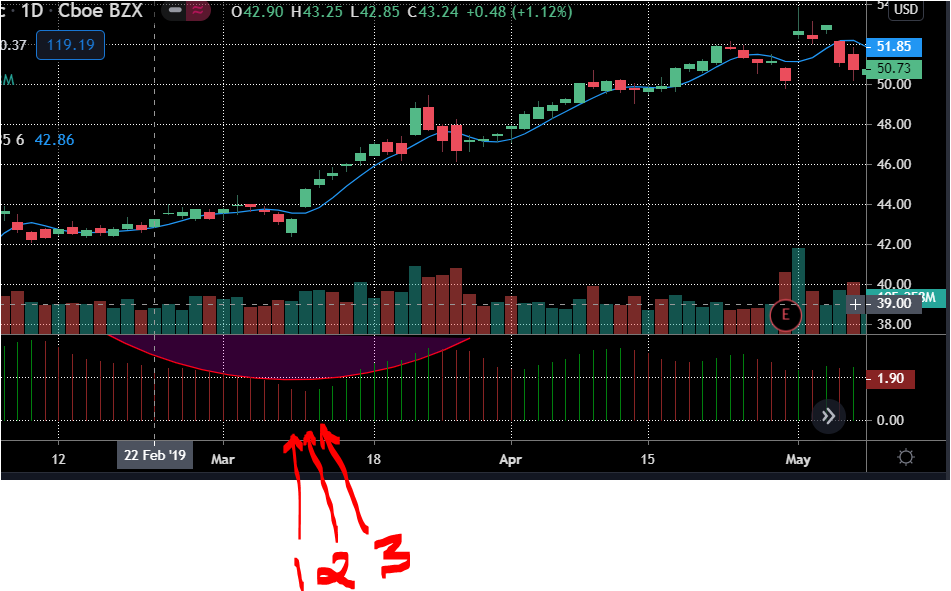
2. A rounding bottom (Saucer)
A rounding bottom a.k.a saucer is a technical analysis pattern that shows the price recovery of stocks. The saucer has three sides:
- Left side: Indicates a downtrend of the price
- Right side: Indicates the price recovery (uptrend of the price)
- Bottom: The bottom level reached by the price
Investors can use this pattern on the AO indicator to enter and exit the market.
The pattern helps investors to spot changes in the momentum and it only uses three consecutive bars.
The saucer indicator can be used as follow:
- Bearish saucer: You will need three bars to form a bearish saucer and all of them must be under the zero-line. The first two bars must be green with the first being longer than the second and the last bar must be red.
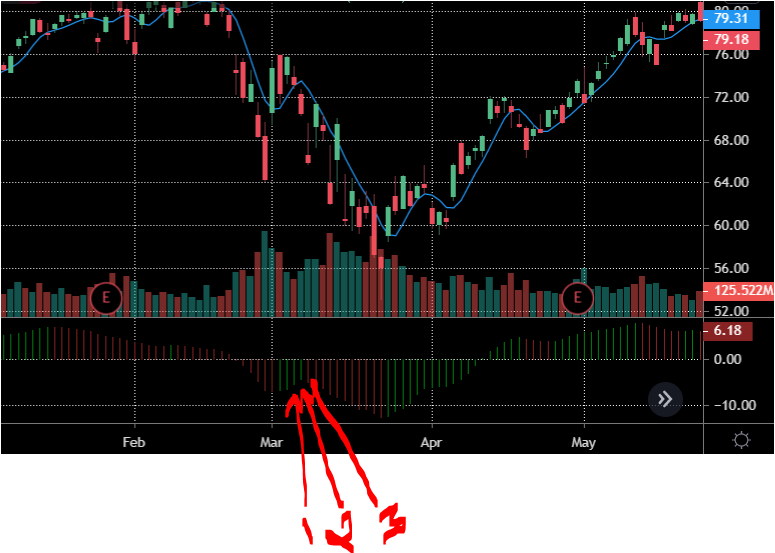
- Bullish Sauser: A bullish saucer is indicated by three bars and all of them must happen above the zero-line. The first bar must be a long red bar followed by a smaller red bar which is then followed by a green bar.
Investors can enter or exit their positions depending on their trading strategies using these patterns.
3. Twin Peaks patterns
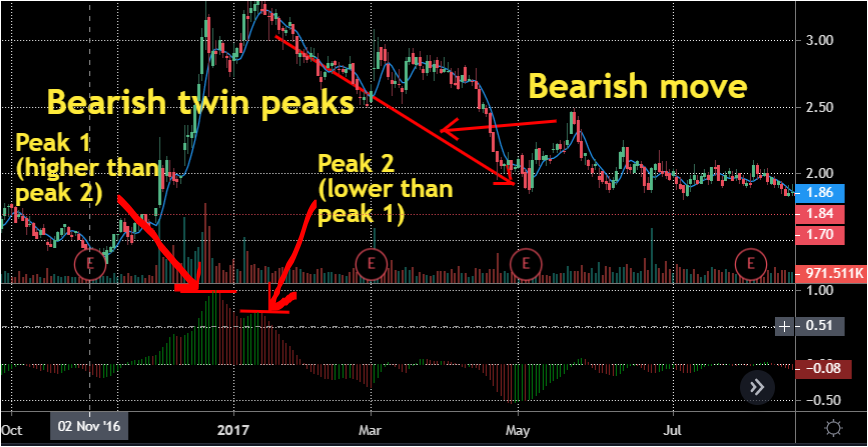
The bearish twin peaks occur at different levels above the zero line. The first peak must occur above the second peak. In order words, the first peak has longer bars which make it form much higher(in the positive section of the zero-line) compared to peak 2. At the same time, peak 2 has lower bars and this makes it form much closer to the zero- line.
This formation will indicate a bearish movement.
NOTE: In order to validate a bearish movement, both peaks must occur above the zero-line and the first peak must occur higher than the second peak.
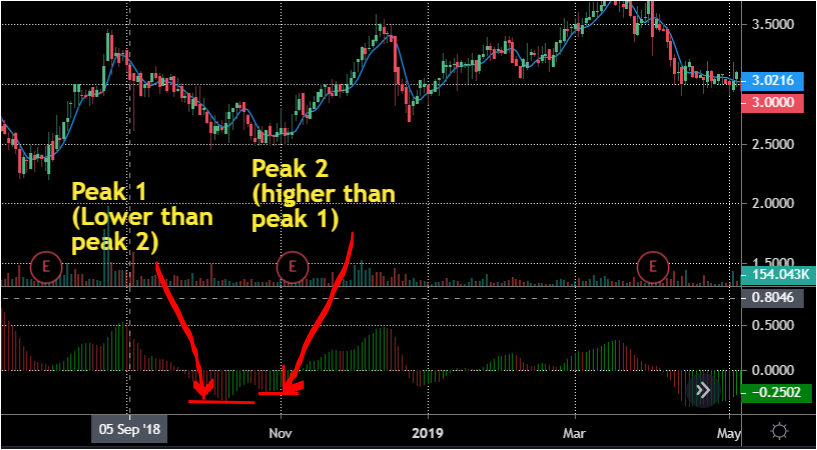
Bullish twin peaks are formed below the zero-line and the first peak is lower than the second peak. In order words, the peak will have more negative values which will give it longer bars. As a result, it will be formed much lower (in the negative territory) compared to the second bard. On the other hand, the second peak will have shorter bars, as a result, it will be much higher(close to the zero-line) compared to peak 1.
This pattern will be a confirmation of a bullish movement to follow.
Note: A green candle must follow the peak to validate the pattern.
More trading indicator resources
- Average True Range(ATR): What Is The ATR?
- Average Directional Index (ADX): What Is ADX?
- Fibonacci Retracement: Basics And Definition?
- Relative Strength Index(RSI): What Is The RSI?
- Accumulation/Distribution (A/D): What Is A/D?
- Simple Moving Average(SMA): What Is SMA?
- Weighted Moving Average (WMA): What Is EMA?
- Exponential Moving Average (EMA): What Is EMA