What is accumulation/Distribution?
The accumulation/distribution is a technical analysis indicator that assesses the strength of a trend by evaluating whether a stock is being distributed or accumulated. This indicator relies on the data pulled from the price and volume of stocks and other securities.
This indicator helps investors and traders to predict the future trends of assets. More supply (sellers) will make the price go down. On the other hand, more demand (buyers) will make the price go up. So, the indicator continues to value how the supply and demand are affecting the price.
How does the accumulation/distribution works?
The accumulation/distribution is an accumulative indicator. This means that as the stock is being bought and sold, the indicator continues to evaluate the divergence between the price and the volume.
>> If the accumulation/distribution line is dropping, it will be an indication of a downtrend. Traders take short positions in a stock when the A/D is dropping and those with long positions exit their trades.
>> When the accumulation/distribution line is going up, it will be an indication of an uptrend in the stock price. Investors with short positions exit their trade whereas others take long positions in an anticipation of a rise in the price.
>> If the Accumulation/distribution line is increasing but the price is dropping, it will be an indication of a possible reversal in the trend. In order words, the price may start rising in the near future.
>>Lastly if the A/D is declining but the price is increasing, it will indicate a weakness of the demand. This is because there may not be enough volume to justify the rise in the price. The stock my start dropping in the near future.
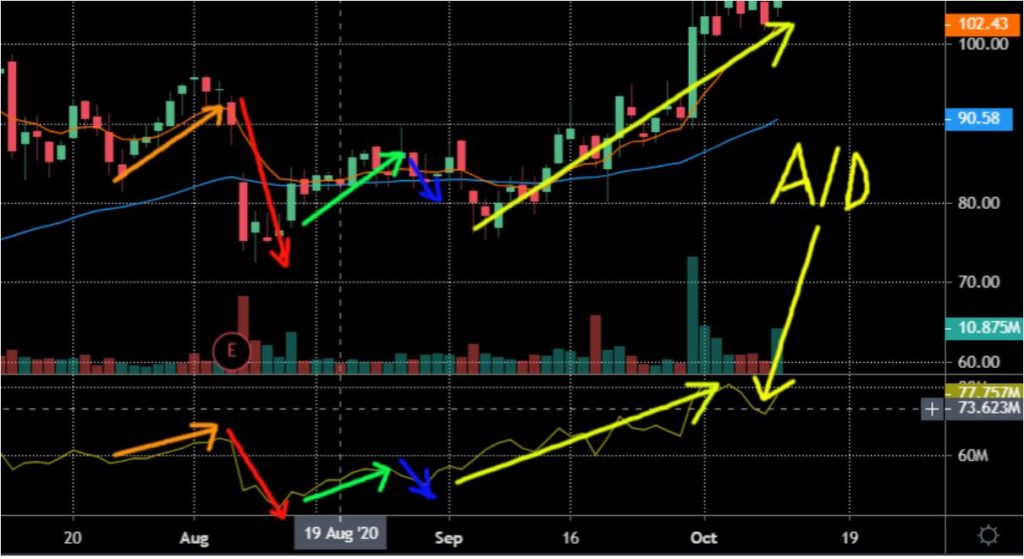
Example A/D on a chart
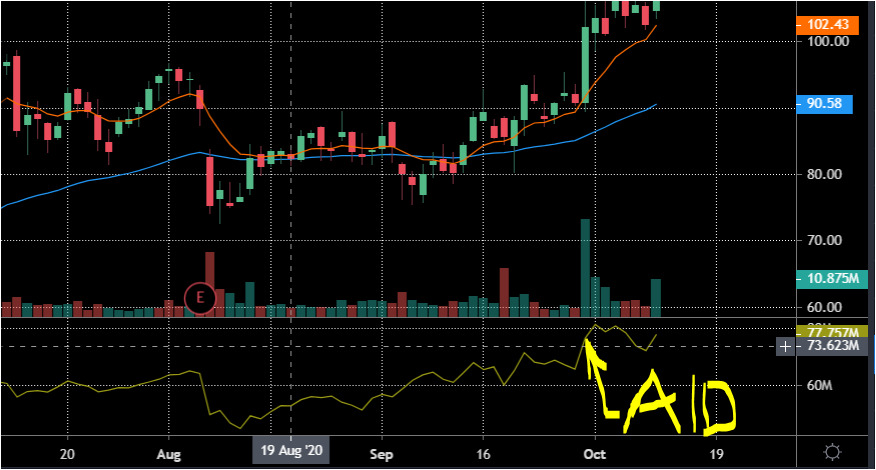
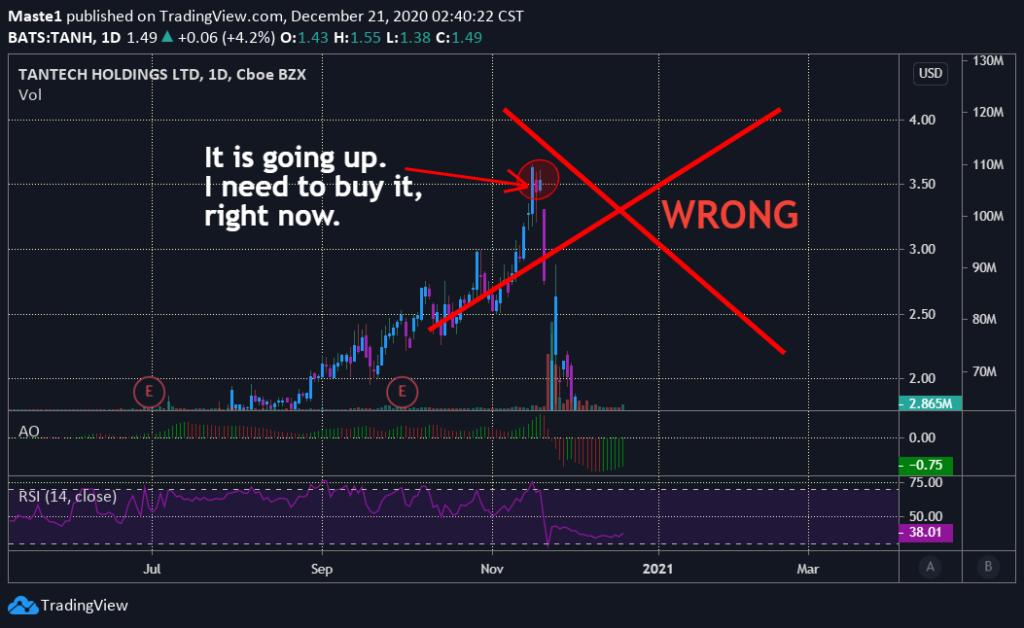
The A/D indicator can be used on the chart to help you understand the possible direction of the stock price. It can also be used to confirm the price’s trend.

Benefits of accumulation/Distribution
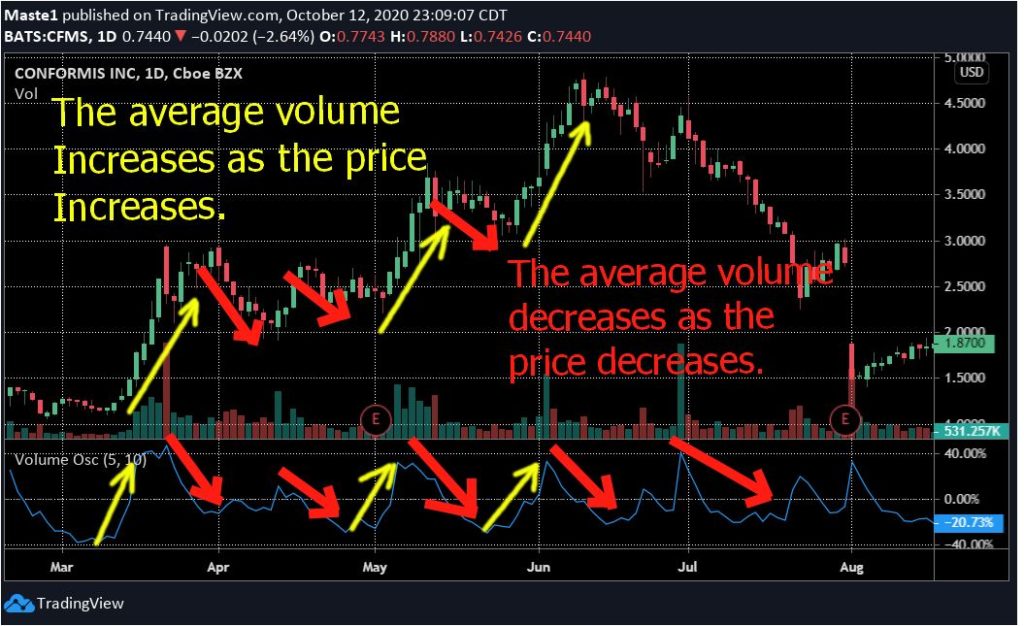
The A/D indicator helps investors to understand the direction of the asset’s price. In other words, the indicator will be used to assess how the demand and supply are affecting the price. If the stock is experiencing a heavy sell-off or buying, the indicator will be used to confirm this information.
Furthermore, the indicator will come in handy when investors are trying to find a false trend. For example, if the price continues to increase without the volume to justify the rise in price; the indicator will move against the price. This will show investors that the price may soon drop due to the lack of volume.
At the same time, if the price is dropping without enough volume, the indicator will move up. This will indicate a weakness of sellers. If sellers are not strong, the price could go up in the near future.