What is RSI?
The relative strength index is a momentum indicator that investors and traders use to measure the performance and change in price movements of securities (stocks, currencies, ETF, gold, etc). This indicator tells investors when stocks or other securities are overbought or oversold.
What are the ranges of the relative strength index?
The RSI oscillates between 0 to 100. The most important numbers in this range are 30 and 70.
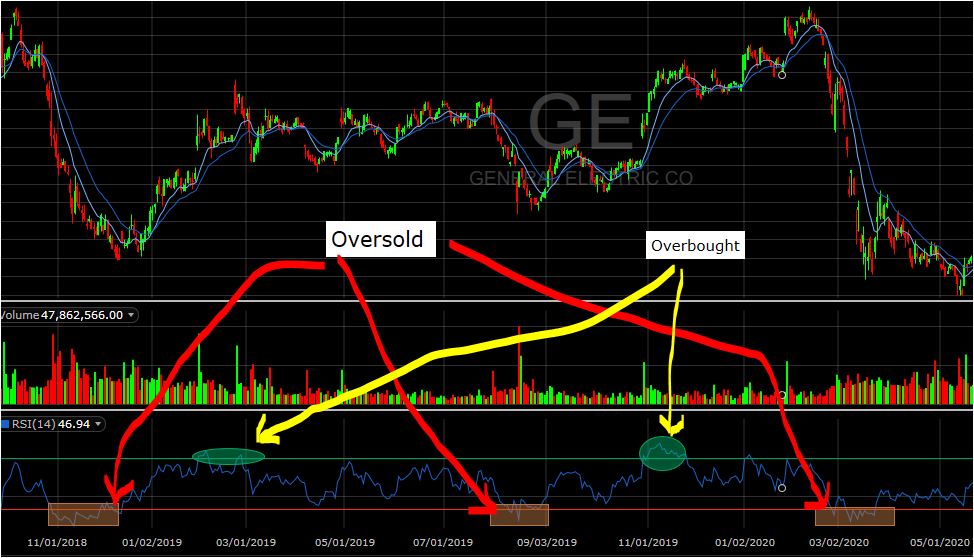
The stock or another asset is considered overbought when its RSI is above 70 and oversold when the RSI is under 30.
For this reason, some investors wait for the RSI to drop below 30 before they take positions.
At the same time, some short term investors and traders exit their positions after the RSI crosses 70. This is because they anticipate a sell-off since the security has become expensive.
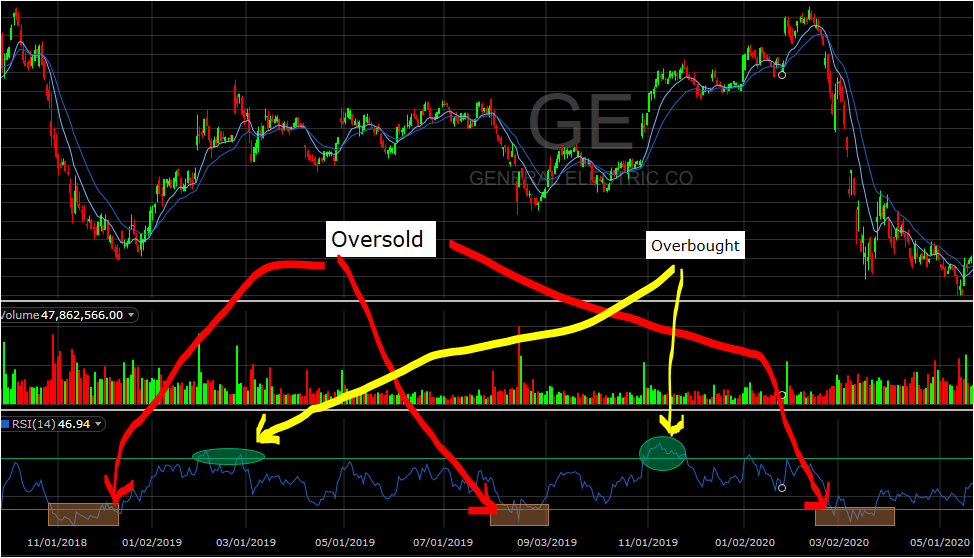
Example of RSI on a chart
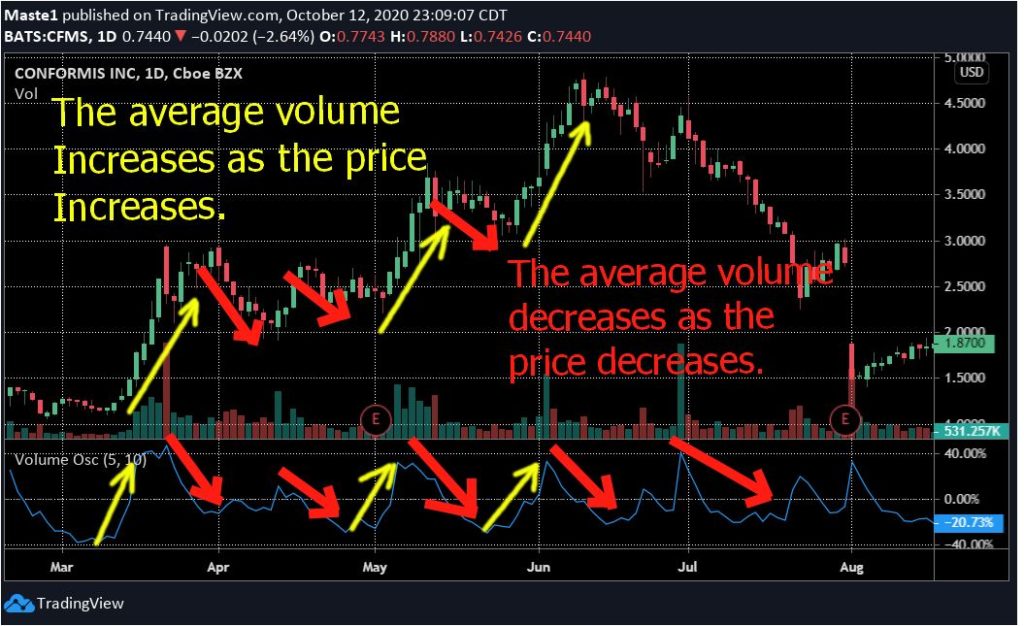
Using a combination of multiple indicators such as RSI and patterns is very important for the success of your investments. Before you use these indicators, you must know how to read them and combine them with information on your trading chart.
The stock price will bounce back and fourth between 0 and 100.
NOTE: Being oversold does not mean that a stock has reached its bottom. As an investor, you must use this indicator carefully. It is possible that the stock can continue to drop much lower. If you want to take a long position in the stock, consider using a combination of multiple indicators along with the RSI for confirmation.
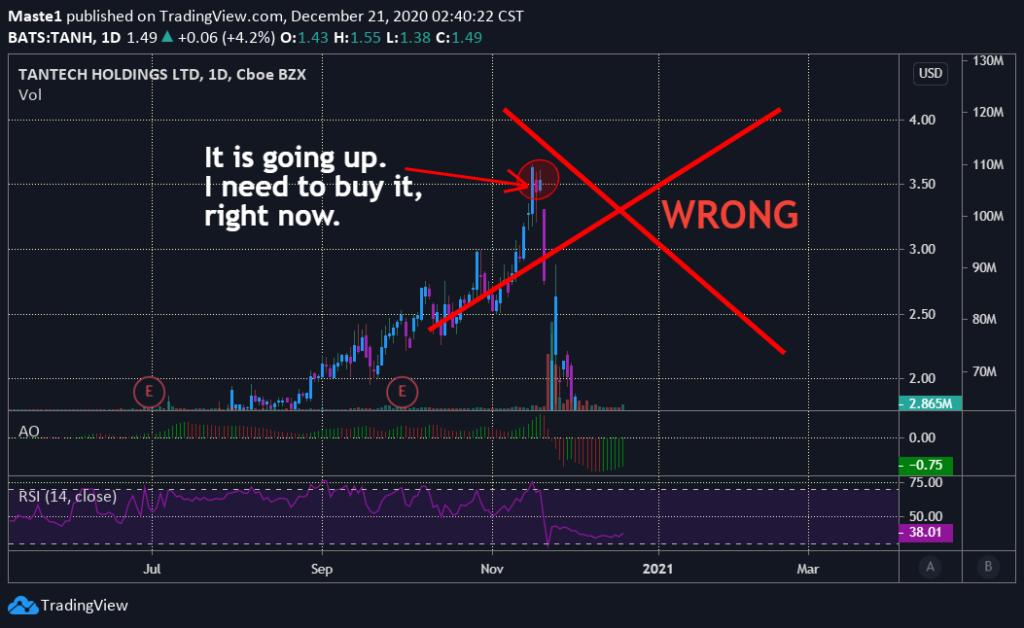
At the same time, being overbought does not mean that a stock has reached its highest price level. It is possible that the stock can continue its uptrend even if it is overbought. Those who are taking positions especially short positions should not rely only on RSI to make their final investment decisions.
Benefits of the relative strength index
- The RSI can help you spot the general trend of the stock and other securities you are trading
- It will help you know when an asset is oversold or overbought
- The RSI can help you confirm the breakout
Disadvantage of RSI
Although the RSI is important, it has some limitations. The following are some of the disadvantages of RSI.
- It is not enough to make a final decision
- The RSI can be confusing when it comes to spotting the general trend
- It can stay in overbought or oversold for a very long time