To succeed in the stock market, you will need to understand what is happening behind the scene. There are a lot of techniques and methods used in technical analysis. However, the most important and basic thing to do is to understand and be able to read candlestick formations. Knowing the best candlestick formations will be a good start.
All candlesticks are important as they represent what is going on at the time frame they represent. However, there are candlestick formations that can give you the best prediction of the market direction.
If you have been wondering about the best candlestick formation you can use, we have compiled our top 13 candlestick formations for you.
A bullish candlestick formation simply means that the candlestick after the formation should be bullish and the market has a higher chance of going up.
A bearish candlestick formation means that the candlestick after the formation should be bearish and the market has a higher chance of going down.
1. Engulfing candlesticks (Bullish or Bearish)
Engulfing candlestick formation is made of two candlesticks. One bearish candlestick is followed by a large green candlestick that exceeds both the high and the low of the red candlestick.
The price actions behind this pattern simply mean that after the selling pressure (shown by the red candlestick), buyers jumped into the market and dominated sellers. This is shown by a big green candlestick that follows the red candlestick.

It is important to note that sellers pushed the price below the first candlestick(red) before buyers took over. In this case, buyers pushed the price back up until our green candlestick closed above the red candlestick. This is an indication of a bullish movement and therefore, the next candlestick after the green should be a green candlestick. For this reason, the market has a high potential for a bullish movement.
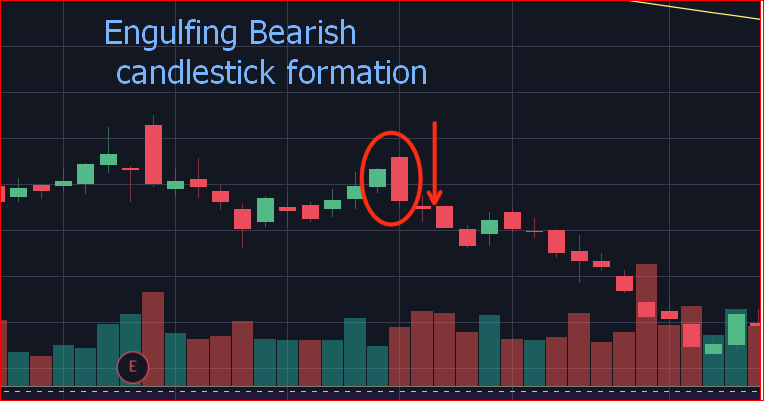
This formation signals a bearish move when the red candlestick engulfs the green candlestick. In other words, the red candlestick opens higher or at the same level as the green candle but sellers dominate the market and the red candle closes lower than the previous green candle.
This is an indication that the following candlestick will be a red candlestick.
2. Doji candlestick patterns (Bullish and Bearish)
We have a doji candlestick when the opening price is the same or almost the same as the closing price. The price moves up and down but still closes at the opening. Dojis can have long or short wicks. In addition, doji candlesticks have many forms depending on whether they have long wicks on one side or wicks on both sides.
Doji formations are most effective when they happen after a big rally or a big sell-off.
If they happen after a long sell-off, they indicate the potential for the reversal of the trend. For this reason, the next candlestick after the doji will most likely be green. Or the trend might reverse shortly after the doji formation.
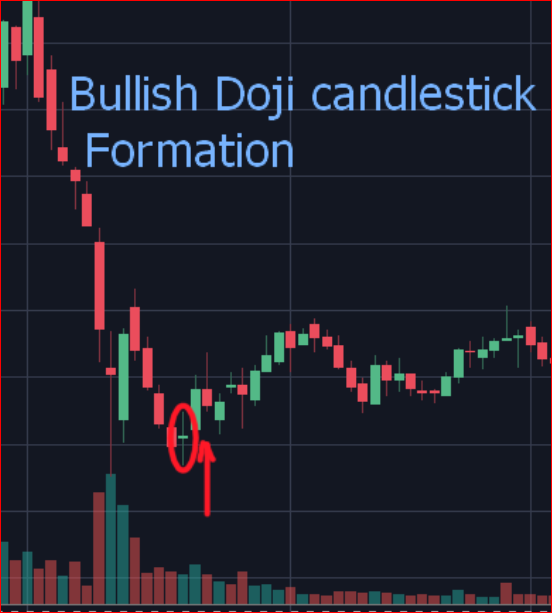
Price action behind a bullish doji: Sellers and buyers push the price up and down until the candlestick closes where it opened. One can safely say that there is a standoff between buyers and sellers. Effective bullish doji formations are the ones that happen after a long sell-off. It indicates that the actual direction of the market is not known. However, in case it happens after a long sell-off, traders do assume a reversal in the trend because sellers might be losing momentum.
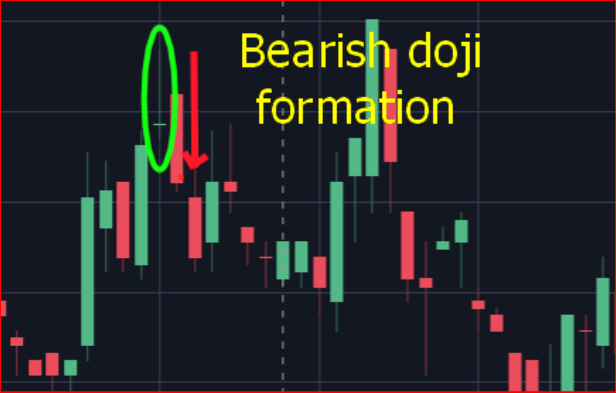
On the other hand, if a doji candlestick is formed after a long rally, it will be an indication of a possible bearish direction. The next candlestick after the doji formation will most likely be a bearish candlestick. Buyers and sellers push the price high and down until the candlestick closes where it opened.
In this case, buyers might be losing momentum and hence a reversal in the trend. Which is indicated by a red candlestick after the doji.
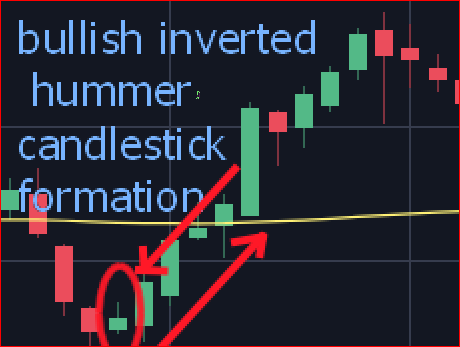
3. Inverted hammer candlestick Formations (Bullish and Bearish)
The inverted hammer candlestick has a smaller body and a long wick on top. This candlestick formation can be an indication of a bullish movement or a bearish movement depending on the location where it happened.
If it is formed on top after a long rally, it might be an indication of a downtrend or bearish movement. We can say that sellers are entering the market and that is the first sign that they are getting stronger.
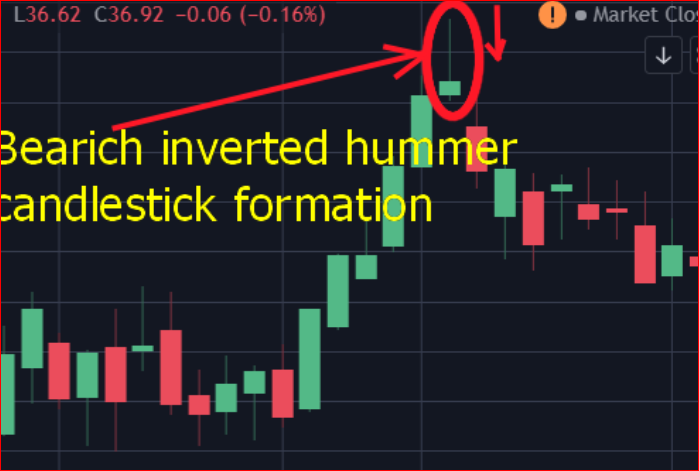
However, if the inverted hammer is formed at the bottom after a big selloff, we can say that buyers entered the market and pushed the price higher. Unfortunately, there are still more sellers in the market. That is why sellers still bring the price down. This can be an indication of potential reversal if this happens at the bottom. Or an indication that sellers are still in charge and the price could go much lower.
4. Hammer candlestick pattern (Bullish and Bearish)
A hammer candlestick formation is the opposite of the inverted hammer formation. It has a form of a hammer and its wick is at the bottom. The body of the hammer candlestick is smaller compared to its wick.
Sellers push the price down but buyers jump into the market and push the price back up until the candle closes close to where it opened.
If the hammer candlestick is formed at the bottom, it is an indication of a possible reversal in the trend. In order words, buyers are starting to dominate sellers.
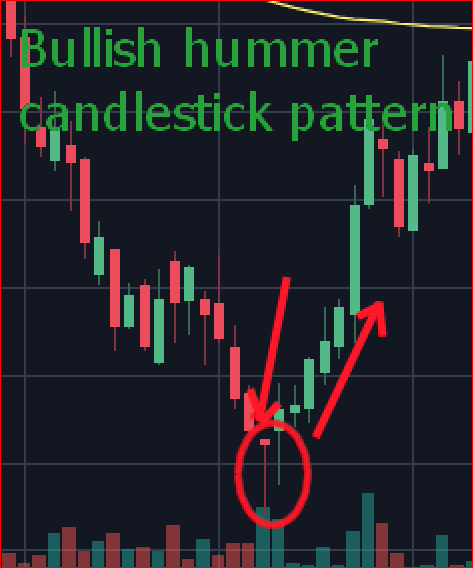
On the other hand, if this pattern happens on top, it could be an indication that sellers are joining the market.
This pattern could also mean that buyers are still dominating and the stock could go much higher (on an uptrend).
The hammer candlestick pattern is more effective and more conclusive when it happens after a long selloff or a long rally in the price movement.
5. Piercing line pattern (Bullish)
The piercing line pattern is a pattern formed by two candlesticks. The first candlestick is a strong big red candlestick. The second candlestick is green and usually opens lower than the red candlestick. The green candlestick closes above or at the center of the red candlestick.
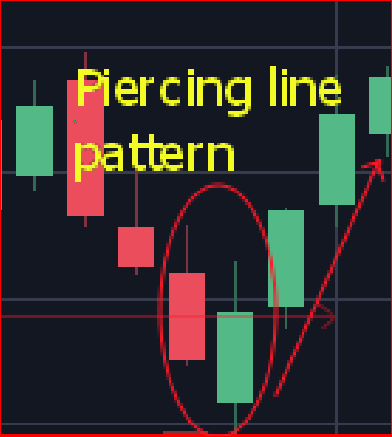
The green candlestick of the pattern indicates heavy buying pressure on the buying side. This is an indication of a potential uptrend taking place. The next candlestick after the green is usually a green candlestick. Therefore, this pattern is a bullish pattern.
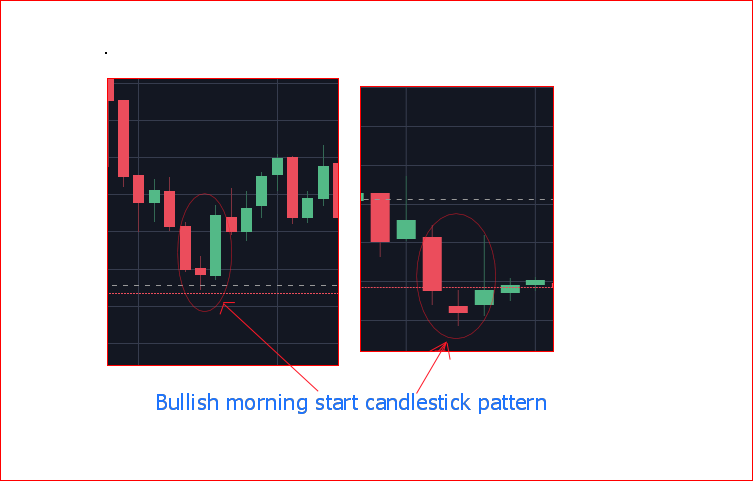
6. Morning star candlestick pattern (Bullish)
This is a three candlestick pattern. The first candlestick is a big red candlestick. The second is a small red candlestick formed after a gap-down. The last is a big green candlestick.
The star candlestick (second red candlestick) does not push much lower which is an indication of fading selling pressure. After the long red candlestick, the stock or security becomes cheaper that is why we do not get another big red candle.
Sellers fail to push much lowers because buyers jump into the market and dominate sellers. That is how we get the big green candlestick. Therefore, this pattern is considered a bullish candlestick.
The next candlestick is usually green but it could sometimes be red within the uptrend.
7. Evening Star candlestick pattern (Bearish)
The evening star pattern happens on the top after a big rally, it might be an indication of a reversal in the trend. It is the opposite of a morning start pattern but the formation concepts are the same.
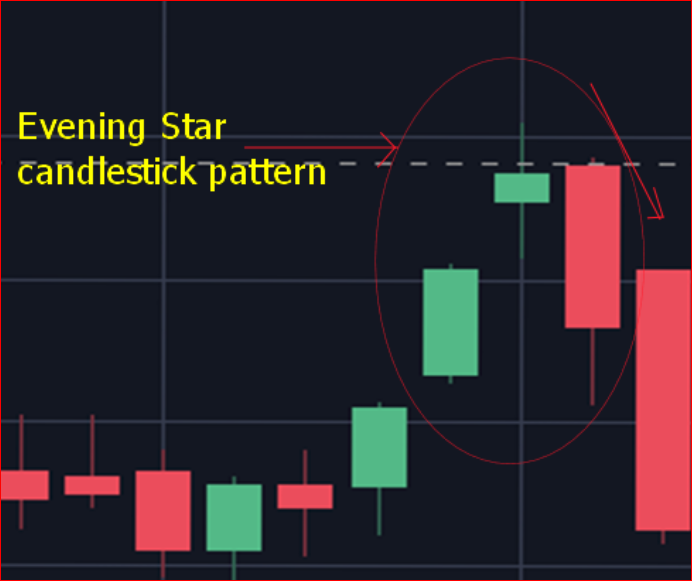
After a long green candlestick, we get a gap up the next day. However, buyers do not push the price much higher. The star candlestick usually has a small wick. The star candlestick is followed by a big red candlestick which indicates the start of a bearish movement.
8. Three white soldiers’ candlestick pattern
This pattern is made of 3 bullish candlesticks where each one closes above the previous one. The pattern happens after a major selloff and buyers take over with strong upward momentum.
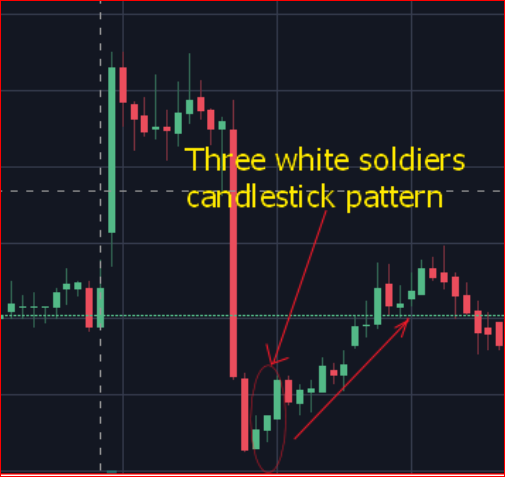
Three white soldiers is a bullish pattern. However, as we know things might change in the market. For example, bad news in the economy can mess up the pattern after it is formed. Therefore, you must approach any trading pattern with caution because the market is unpredictable.
9. Three black crows pattern
You can consider this pattern as the opposite of the three white soldiers’ formations. It is made of three red candlesticks that happen on top after a big rally. This pattern indicates a possible downtrend taking place.
10. Spinning top candlestick pattern (Bullish or Bearish: Decision is unclear)
A sniping top pattern is a candlestick pattern made of two or more candlesticks with small bodies and long wicks. Sometimes, wicks can be smaller depending on the volatility in the market.
This pattern means that it is not clear where the price will go from that point on. This is because buyers did not push the price any higher and sellers are not able to push the price lower.
You can consider this action like a tie between buyers and sellers. For this reason, it is unclear where the price will go from there.
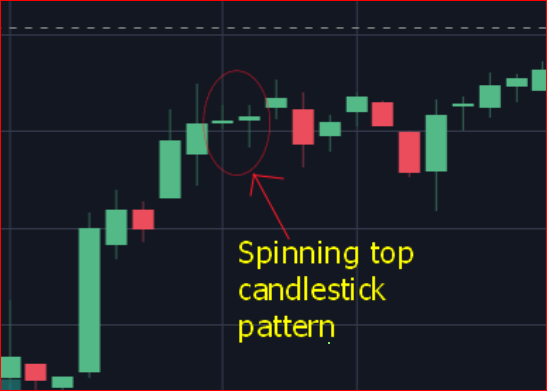
However, one could anticipate the possible direction of the prices based on the recent movement of the stock. If you had a huge rally in the market, the pattern might indicate a possible reversal. That is, buyers might be losing momentum and therefore; sellers could be taking over. You can also come to a conclusion using other indicators and trading patterns.
11. Spinning double bottom pattern
This pattern can be interpreted as a spinning top pattern. The pattern is made of two candlesticks with small bodies. These candlesticks can have small or long wicks.
The direction of the price can be bearish or bullish because buyers did not dominate sellers and sellers did not dominate buyers during these two trading sessions.
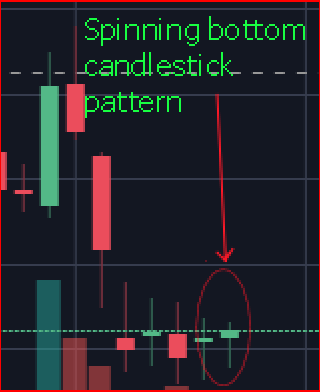
However, you can possibly predict the direction of the price based on the previous movement of the security. If you had a big selloff it could be an indication that the sellers are losing momentum. You need to be careful when trading this formation as the price can go in any direction. You can use other indicators to help you determine the direction of the market.
12. Falling three methods candlestick pattern (Bearish pattern )
The falling three methods happen in a downtrend. Three green candlesticks reverse a downtrend for just three consecutive trading time frames. After these green candles are formed, they are followed by another wave of selling pressure. All these green candlesticks are engulfed by two big red candlesticks.
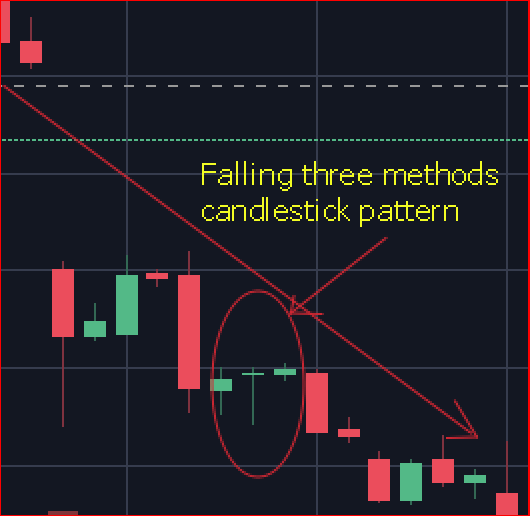
These green candlesticks form a lower high compared to the previous high which is an indication of a downtrend.
For this reason, the falling three methods are a bearish candlestick pattern.
13. Rising three methods candlestick formation (Bullish)
The rising three methods formation is made of three red candlesticks formed after a big rally that ended with a big green candlestick. Each candlestick closes lower than the previous one on low volume and does not break below the last green candlestick. Therefore, there is no indication of a reversal in the trend. All these red candlesticks are engulfed in the two big green candlesticks.
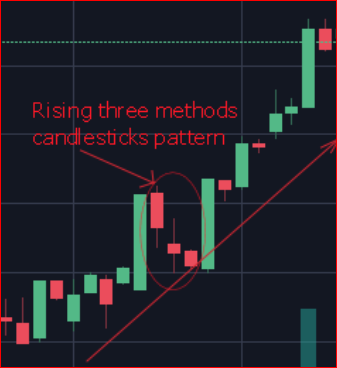
You can treat these red candlesticks like a formation of a pullback within an uptrend.
After these red candlesticks, buyers take over again and the trend continues.
For this reason, the rising three methods pattern is considered to be a bullish pattern.
Final words
All these candlesticks formations are considered the best candlestick formations; because each one of them can help you maximize your gains while minimizing your losses.
It is important to know that the best candlestick formations will not be enough when trading. For this reason, a combination of other technical analysis methods is needed to support your decisions.
You must use proper orders such as limit orders and stop losses in your trading strategies. Never invest more than you can afford to lose no matter how perfect the pattern looks.
Start with a paper money account where stocks and other securities are simulated to help you learn how the market works. You can open a free paper money account with Investopedia or another place of your choice. You can also use your brokerage account if you have that option.
We would like to know what you think. Which ones are your best candlestick formations?