Trend analysis is a technique used by traders in an attempt to predict future directions of stocks and other securities. Trends are analyzed based on the past data. In general, one can make sense of the future by understanding the past.
On charts, trends are shown by trend-lines which highlight general directions of stocks or securities. You can always use trends analysis regardless of whether your trades are short term or long term. In this article, we will discuss types of trends with examples using real life charts.
Table of Contents
1. Types of Trends
There are three types of trends. The first type is the uptrend. This trend indicates that a security has an upward direction and prices will increase over time. The second type is a downtrend. The downtrend indicates that the direction of a stock or a security is downward. This means that prices will decrease over time. The last type is sideways or horizontal trend. The horizontal trend, as the name describes it, prices do not move up or down very much. That is, prices bounce back and forth between two predetermined levels (support and resistance) until we have a breakout.
2. Uptrend (upward trend)
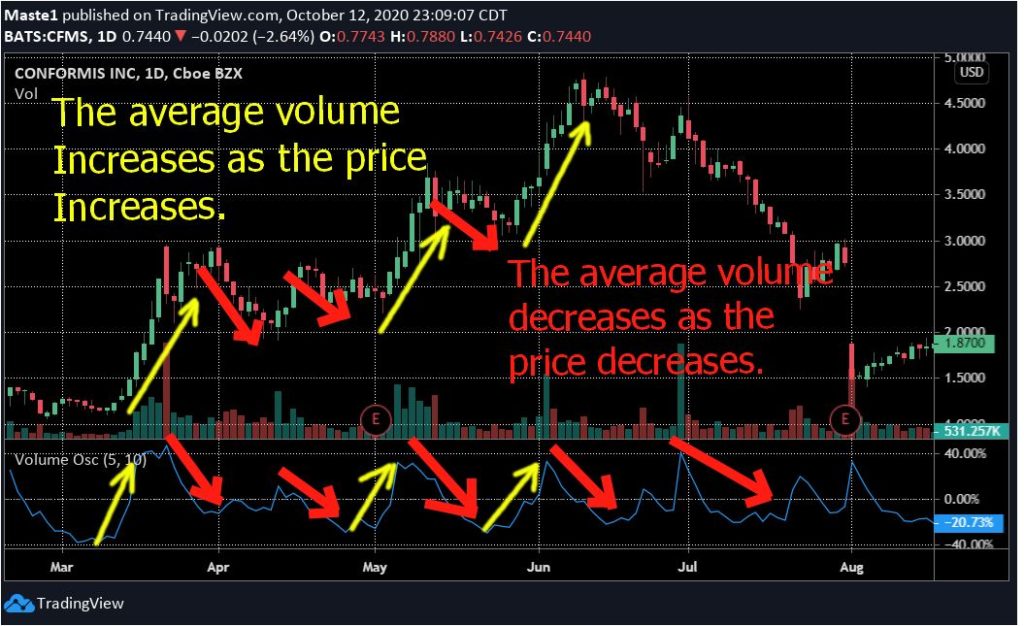
The uptrend is a trend that is market by the increase of prices of a stock or a security over time. The movement of the stock will never be a straight line because prices are always fluctuating. There will be oscillations in the price movement.
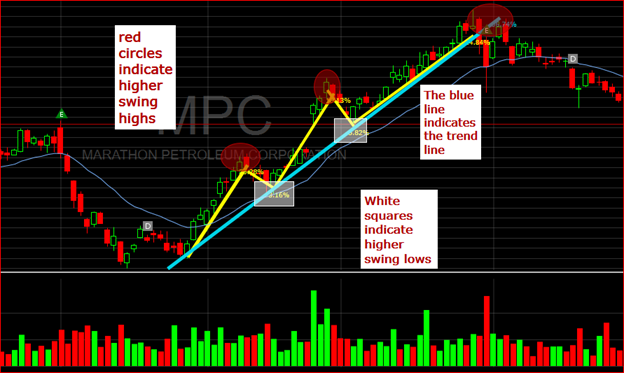
The movement of a stock or a security in an upward trend is characterized by higher swings highs and higher swing lows. In other words, the price rallies in upward direction and retracts little compared to the rally. This small retraction is called a pull back.
A Pull back is indicated by a brief reversal in the current trend of the stock. From figure 1, you can see that the stock rallied and then retracted before continuing in its upward direction. A pull back is also defined as a period where profits are taken. This means that some people decide to take profit after a huge rally. As a result, we get more supply than demand and the price decreases. Once, all sellers are gone, buyers take over again and push prices in uptrend. This process repeats until the trend is broken or fails. The failed trend becomes the beginning of a downward trend (Not all the times).
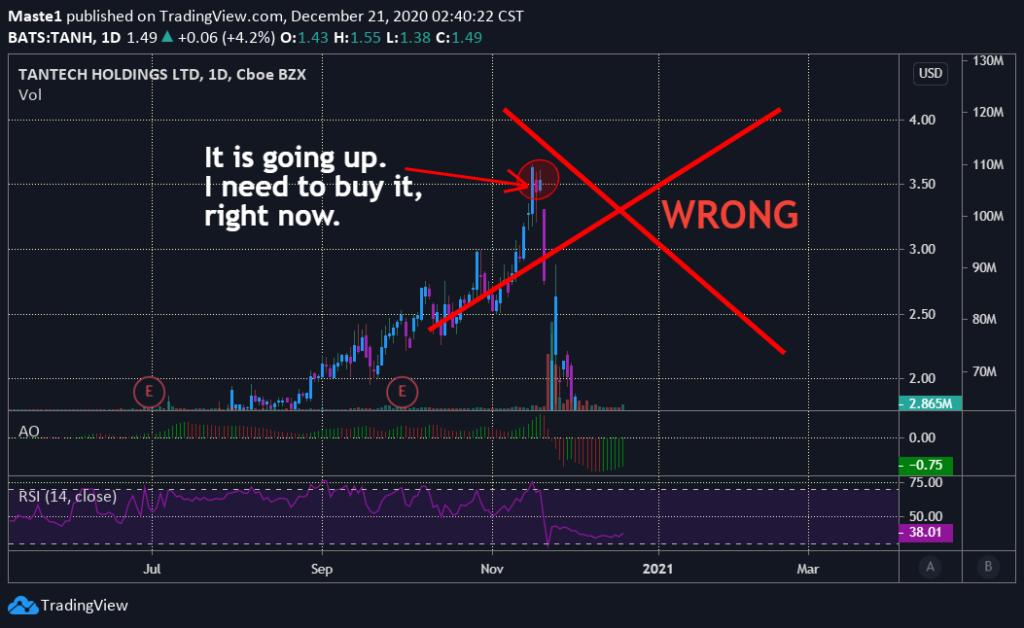
It is important to note that when the trend is broken, it is not always an indication of a downtrend. Sometimes, the market can experience a brief disturbance (for example, bad earnings, etc.) which can cause such issues. If a stock is meant to go up, it will resume the trend direction after the false alarm is cleared.
3. Downtrend (Downward trend)
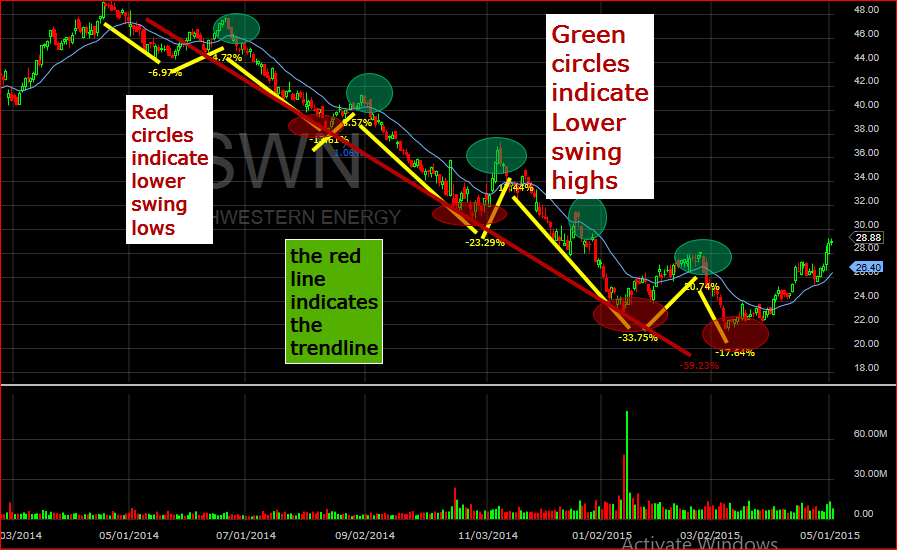
The downtrend is market by a decrease in prices of a stock or security over time. Again, prices do not drop in a straight line. The price will fluctuate while it decreases. You can observe this scenario in Figure 3, below.
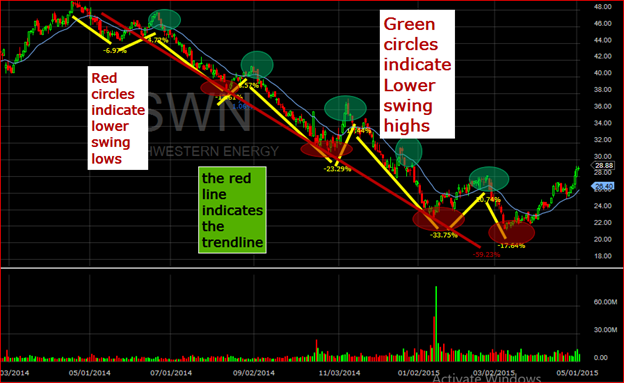
From Figure 3, you can see that what is happening is the opposite of the uptrend. The only difference here is that sellers are dominating. The price slid some percentage and reversed a little. Prices make lower lows . This means that each low price reached by the price is lower that the previous low. The small brief upward movement of the price is due to many things. It could traders who went short and were buying to cover their positions. Or, it could be other buyers who thought that the stock dropped a big percentage and it was time for a reversal in the trend. Some of these events happened at support areas which can justify the sentiment of buyers.
You can clearly see that high prices reached by the stock are lower than the previous highs. This is an indication of a market dominated by sellers. The downtrend is always characterized by lower swing highs and lower swing lows. Lower swing highs means that the high swing made by the stock never reach the level of the previous high. So, if you draw a line that connects your highs, it will be a down slopped line. Lower swing lows simply mean that lows made are always lower than the previous lows. If you draw a line connecting the lows it will be a down slopped line. You can observe this scenario in Fig 2 depicted above.
4. Horizontal Trend
As the name explains, horizontal trend is a trend that moves in a horizontal direction as opposed to uptrend and downtrend. This trend occurs between two trading levels (support and resistance). When the price reaches the support level, buyers push it back up until it reaches the resistance level. At the resistance level, the price gets pushed back down by sellers. This process continues until a breakout happens. Please, see the horizontal trend in figure 3 below.
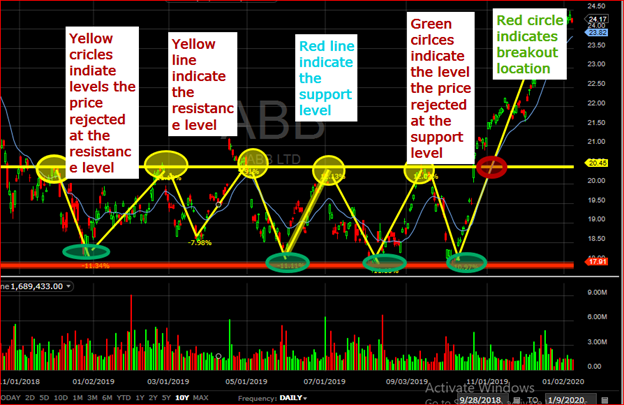
From Figure 3, you can see that the price stayed between $18 and $20.50 for a very long time. Buyers were strong at the support level which pushed the price upward. Once the price got to the resistance level, sellers dominated. This process repeated itself for quite sometimes until the breakout happened. The breakout can happen at the resistance which indicate the uptrend like shown in figure 3. It can also happen at the support level which will indicate the downtrend.
5. Bottom line
Market/stock trends analysis is very important when one is trying to understand the future direction of a market, a stock or a security. Trends can help you reduce your risks on trades. It is recommended that you analyze the trend of a security you want to trade before making decisions.
What is next?
Check out double bottom trading pattern in detail