What is the average true range?
The average true range is an indicator that measures the volatility of markets, stocks, and other assets. This indicator was invented by Wells Wilder to measure the volatility of markets based on absolute values instead of percentages, according to Chart-formations.
Depending on the market sentiments, the prices of assets can change much faster or slower with high or low spreads. This change in prices represents the volatility of assets.
Savvy investors take advantage of volatility to increase returns on their investments. One of the most important indicators investors use to measure the volatility is the average true range.
How does the average true range works?
The average true range is calculated for every time frame. For example, if you are using a daily chart, you will have one ATR point every day. Once you have many ATR values, you can then use them to plot the ATR line.
The default period for ATR is 14. However, a trader can change the period and input the value he/she prefers. Those who want to measure the recent volatility must use a shorter time period usually under 10. On the other hand, the long-term volatility should be calculated using a longer period usually between 20 and 50, according to Fidelity. During the calculation of ATR, investors must consider all price movements and situations including gaps.
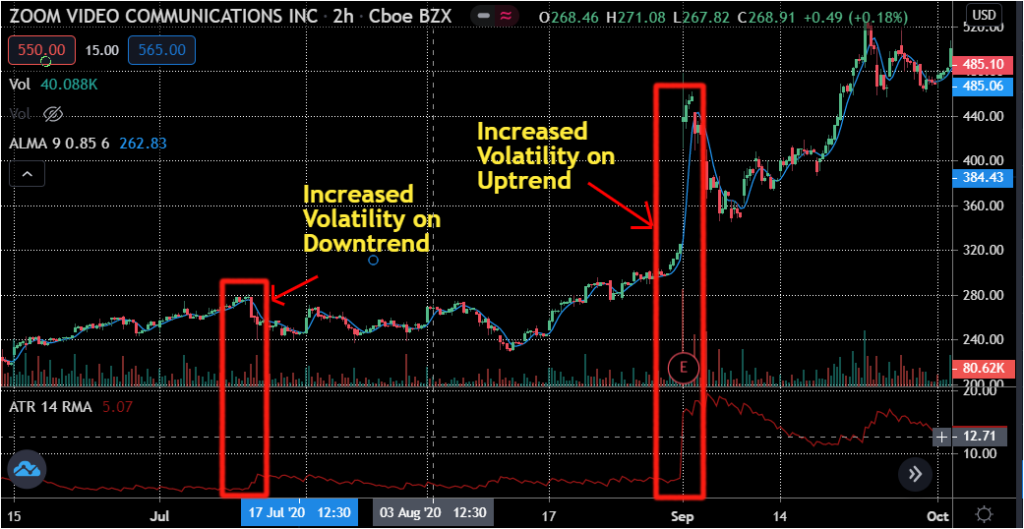
The ATR values will increase or decrease based on the buying and selling pressure of assets. For example, if a stock has good news, many investors will want to invest in it. As a result, its volatility will increase. Investors can then use this information to confirm the price movement and the trend in direction of the price.
At the same time, low ATR values indicate the low volatility of stocks and other securities. For example, if a stock is consolidating, its price and volume will not change much. This will be reflected by low ATR values.
What is the formula of ATR?
The average true range is calculated based on the previous average true range and the true range(TR) over a period of time.
The True Range is the biggest among the following three calculations, according to the balance and Fidelity. These calculations are based on a daily chart. However, investors can use a time frame of their choice.
- Today’s high minus today’s low
- Today’s low minus the previous day’s close (absolute value)
- The absolute value of today’s high minus the previous day’s close.
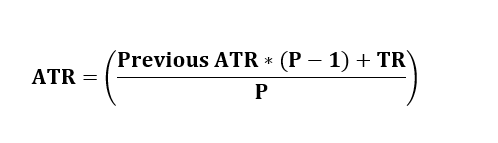
Where
P = The number of periods
TR = True range (from the calculations above)
ATR = Average True Range
Benefits of the average true range
The average true range is a powerful indicator as it can help investors to understand the price movements of assets and stocks they are trading.
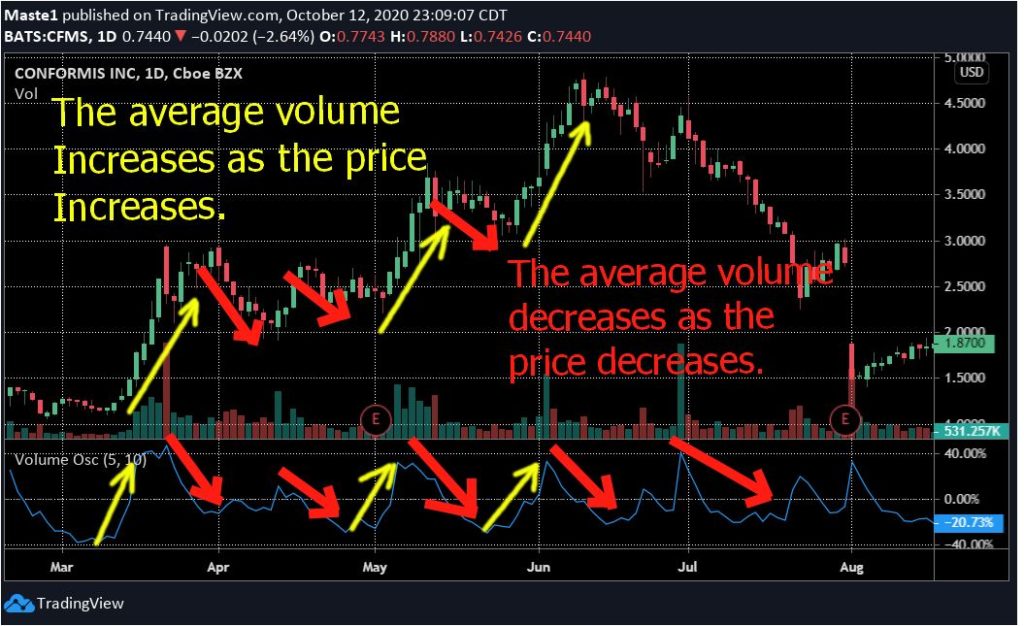
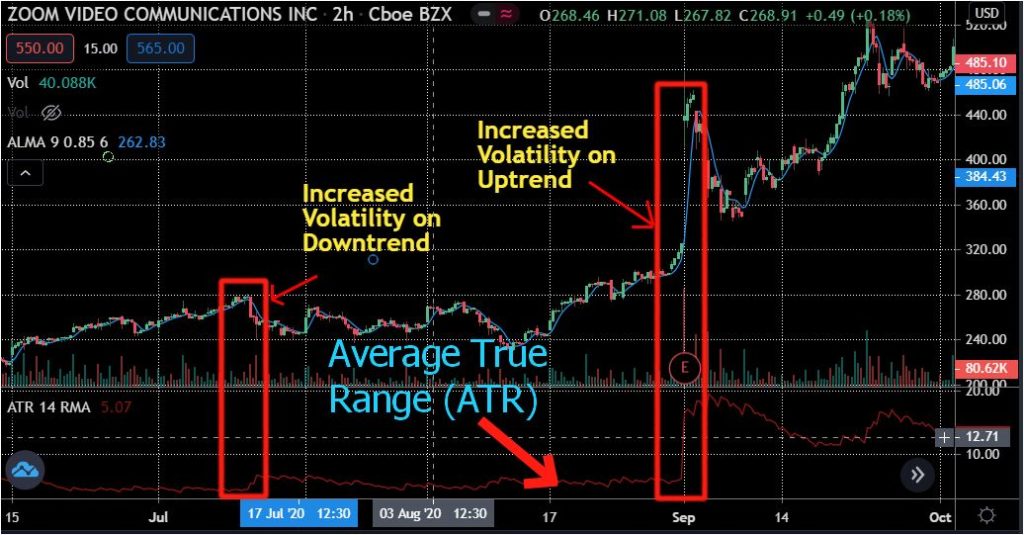
For example, if the stock’s volatility is increasing in the uptrend on high volume, this can indicate further growth in the uptrend. From this information, investors can take long positions to get maximum returns or end their short positions to reduce major losses.
The opposite can also be true. If a stock’s volatility is increasing on a downtrend with a high volume, it could be an indication of an extended bearish movement. Investors can then exit their long positions to minimize their losses. Those who short stocks can take short positions.
An ATR can also help investors to minimize their losses and maximize their gains by setting up stop-loss and trailing-stop orders. For example, the ATR will have more values in the morning and gradually decline throughout the day. This is because stocks are volatile right after the market opens.
If the volatility of a stock you are trading is getting lower while the price declines, this will indicate fewer buyers in the market. In order words, sellers will continue to get rid of their shares as the price goes down. Investors can use stop-loss orders to minimize their losses or use trailing stops to lock in some of the profits they already made.
More trading indicator resources
- Average Directional Index (ADX): What Is ADX?
- Fibonacci Retracement: Basics And Definition?
- Advance-Decline Ratio (ADR): What Is The ADR?
- Accumulation/Distribution (A/D): What Is A/D?
- Exponential Moving Average (EMA): What Is EMA
- Relative Strength Index(RSI): What Is The RSI?
- Simple Moving Average(SMA): What Is SMA?