What is Weighted Moving Average?
A weighted moving average is a statistical indicator used in technical analysis when making decisions about buying or selling stocks and other tradable assets. According to fidelity investment, the weighted moving average puts more weight on recent prices and less weight on the past prices. It is one of the few moving average types used in technical analysis.
The weighed moving average helps investors and traders to enter and exit trades.
A WMA is different than the simple moving average(SMA) because you do not use weight when calculating a SMA.
How to calculate a weighted moving average?
To calculate the weighted moving average, you will follow the following steps.
Step 1: Decide the period (n) or length to use for your calculations
Step 2: Decide the weight (Wn, where n can be 1,2,3,4,…) to be used on each data point. In this case, W1 will be used on the first data point. W2 will be used on the second data point, etc.
Step 3: Multiply each data point with its corresponding weight to calculate weighted averages.
Step 4: Add all values from step 3 to find the final answer.
The formula of WMA
Weighted Moving Average (WMA) = A1*W1+A2*W2+A3*W3+…+An*Wn
The sum of all weights must be 1 or 100% in you are using percentages.
A visual representation of WMA on a chart
Example of Weighted Moving Average calculation
Step 1: Decide the length or period n to use in your calculation
Let’s assume that you want to use a weighted moving average of lenth10. This means that we will need stock prices for 10 consecutive days.
The following are 10 days prices of XYZ stock we are going to use in our example. $1.5, $2, $1.8, $1.7, $1.9, $2.12, $2.2, $2.05, $2, and $1.95.
We are going to assume that our numbers are organized from the most recent to the last.
Step 2: Decide the weight for each price point
Now that we know our data and period, it is time to decide the weight to apply to each data point. Remember the highest weight will be used on the most recent price and work our way back.
Since we need the sum of all weight to be 1 and we have 10 numbers, we can use the following weight: 10/55, 9/55,8/55, 7/55,6/55,5/55, 4/55, 3/55,2/55,1/55. We chose these numbers because the sum of 1,2,3,4 all the way to10 is 55.
Step 3. Multiply each price with its corresponding weight
This is how it will be done. The most recent price will be multiplied by the biggest weight. That is 1.5*10/55, 2*9/55,1.8*7/55,………, and finally, 1.95*1/55.
Step 4: Calculate the sum of all WMAs
After calculating all weighted averages, we will add them together to find our final answer. This value will be our first point in the moving average calculations.
As new data come in, the oldest value will be removed from the set and a new point will be calculated using the same formula.
This process will continue until we have enough data points that can be plotted on the chart. Please, refer to the following table for more details on the calculations.
| Date | Price | Weight | Weighted averages |
| 1 | 1.5 | 10/55 | 0.27 |
| 2 | 2 | 9/55 | 0.33 |
| 3 | 1.8 | 8/55 | 0.26 |
| 4 | 1.7 | 7/55 | 0.2 |
| 5 | 1.9 | 6/55 | 0.2 |
| 6 | 2.12 | 5/55 | 0.193 |
| 7 | 2.2 | 4/55 | 0.16 |
| 8 | 2.05 | 3/55 | 0.11 |
| 9 | 2 | 2/55 | 0.073 |
| 10 | 1.95 | 1/55 | 0.035 |
| Sum=1.00 | Sum= $1.761 |
The calculated moving average point is $1.761. The next point will be calculated using the same formula. However, the oldest point will be discarded as the new one comes in. That is, on the following day a new price will be used and $1.95 will be removed.
Benefits of weighted moving averages
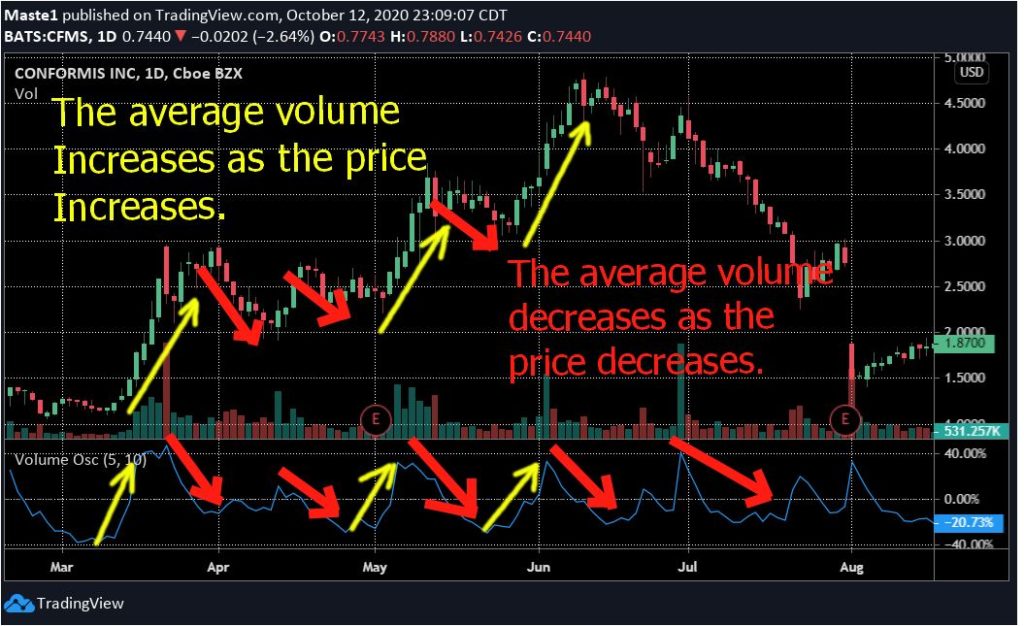
- A weighted moving average can be used to indicate the price trend
- The WMA can be used as a support level or resistance level. For example, a trader can make trades of buying or selling a stock or an asset if its price breaks above or dips below a weighted moving average.
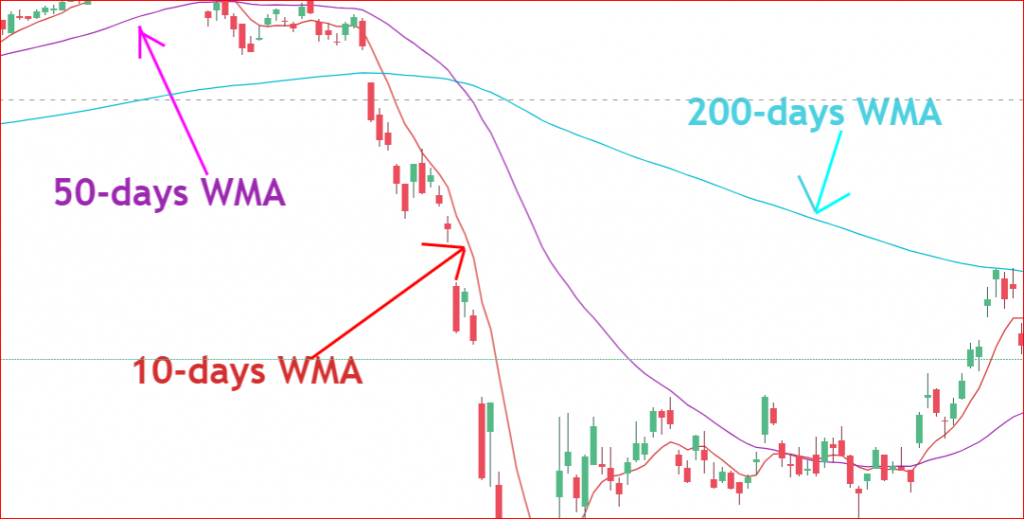
- You can use a combination of multiple weighted moving averages to know when the trend is changing. For example, if the long term WMA breaks above the short term WMA, it will be an indication of a downtrend coming. On the contrary, when a short term WMA breaks above the long term WMA, it will indicate an uptrend. You can observe this scenario on the chart above where we showed a 10,50, and 200 days WMAs.
Final Words
Like other moving averages, the WMA will help you smooth your data in order to see the trend easily. However, this indicator is not perfect as it is sensitive to sudden spikes in the price movements. For this reason, using multiple indicators can reinforce your trading conclusions.
Happy Trading and Investing !