What is average age of Inventory ratio?
The average days of inventory is a ratio that shows the average time in days it takes for a company to turn its inventory in a given period of time usually in a year, According to Accelerated Analytics. A low number shows that a company flips its inventory fast, and therefore, it can generate more revenues.
On the other hand, a high average age of inventory is an indication of bad management and improper use of the capital.
Formula of average age of inventory
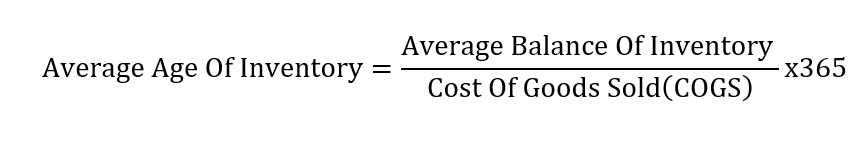
The average age of inventory measures the time in days it takes to sells an inventory, according to Chron. To calculate the average age of inventory, you would first calculate the average balance of inventory within a given time.
Next, you will divide the result by the cost of goods sold (COGS). The final step in calculating this ratio is to multiply the result by the number of days in a year (365).

The following article can help you learn how to calculate average (if you need help with it).
>>Related: Average: What Is The Meaning Of Average?
In this formula,
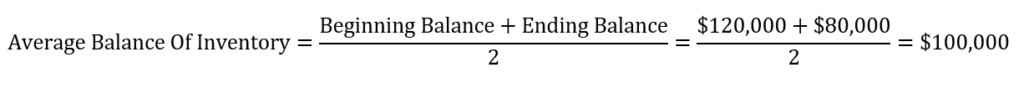
The average balance of inventory = The sum of the beginning and ending inventories divided by 2 (in a year).
Cost of Goods sold = Beginning Inventory – Ending inventory + Additional Purchases
Example
Let’s assume that at the end of the year XYZ company reported a beginning and ending inventory balances of $120,000 and $80,000 consecutively. In the same period, the company reported $750,000 in the cost of goods sold. What is the average age of inventory?
To answer this question, we will use the following steps.
Step1: Calculate the average balance of inventory
Step 2: Calculate the Average age of inventory

From our calculations, we found that the company has an average age of inventory of 38.7 days. In other words, it takes 78.7 days on average to sells its inventory.
Why does the average age of inventory matter?
Companies must sell their inventories in order to recover money tied in it (inventory). For this reason, the average age of inventory shows how efficiently a company recovers and uses its capital.
A lower number of days shows that a company does a good job of flipping its inventory. Flipping inventory fast brings money back into the company which increases revenues. Companies with a higher ratio show better management and better use of their assets.
On the other hand, the high average age of inventory is associated with a lower performance. The longer a company keeps its inventory, the fewer sales it makes. Fewer sales bring in fewer revenues.
This ratio can also be used to compare companies in the same industry. A company that turns its inventory faster is more likely to make more profits, and therefore, it is a better investment.