An ascending triangle is a bullish formation pattern used in technical analysis that occurs within a continuation of a trend. The highs of the triangle reach the same level which is the resistance level. The price forms lower highs that touch or get close to the uptrend support level.
In this article, you are going to learn in detail what an ascending triangle pattern is and how to spot this pattern. Furthermore, you will learn how to trade with this pattern.
Table of Contents
- Understanding the ascending triangle
- Spotting an ascending triangle pattern
- Trading with ascending triangle pattern
- Going long using ascending triangle pattern
- Shorting using ascending triangle pattern
1. Understanding the ascending triangle
The price movement form swing highs that reach the same level. This level where prices are not able to break is our resistance level.
The price movement forms swing lows that traders can connect with a rising support trendline. This trendline is considered to be a support level since prices do not break below the line.
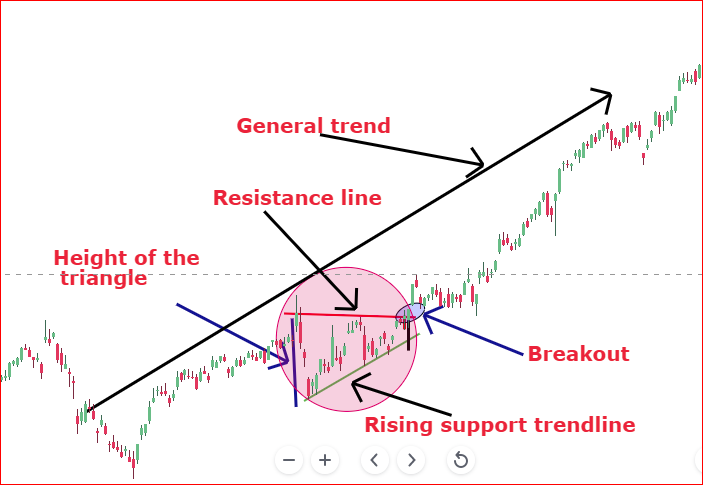
You can observe the height of the triangle, breakout, resistance, and resistance levels in Figure 1 depicted above.
The ascending triangle is a type of continuation pattern. This means that the breakout happens in the same direction as the general trend of the price movement. It is important to know that breakouts can also happen in the opposite direction of the trend.
Validation of an ascending triangle pattern
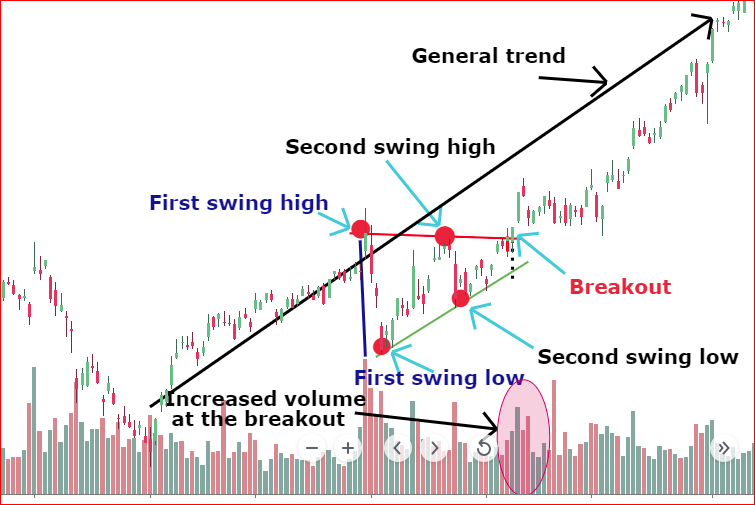
A minimum of two swing lows and 2 swing highs is necessary to confirm the pattern as an ascending triangle. Also, it is important that swing highs end at the same resistance level which will create our horizontal line. Also, the rising support level will connect the higher lows formed by the price movement.
Some of the factors that must be met to qualify as an ascending triangle pattern
- Resistance on swing highs: The top horizontal line is formed by at least two swing highs. There might be more swing highs and lows within the triangle.
- Trend: A defined uptrend or downtrend must exist and the ascending triangle must occur in this trend
- Ascending support trendline: At least two higher lows must occur to draw the ascending support trendline. It is possible for multiple swing lows to reach this trendline but only two are necessary.
- Duration: The duration of an ascending triangle pattern is estimated to be between 1-3 months
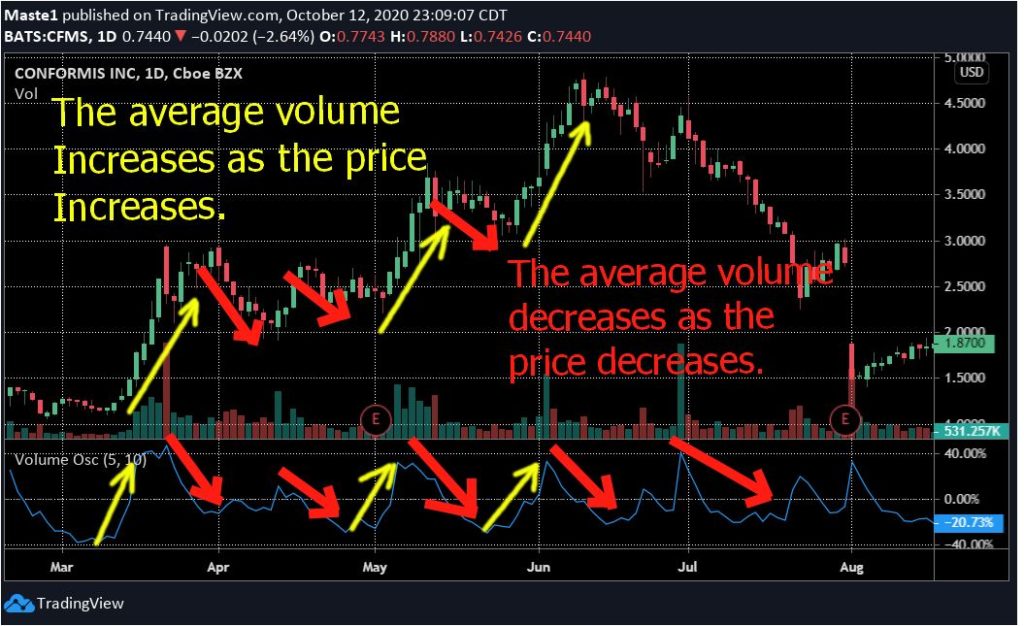
- Volume: The volume is usually low during the ascending triangle pattern. This is due to the lack of clear direction of the price in this consolidation period. However, the volume increases after the breakout as many traders buy the stock heavily.
2. Spotting an ascending triangle pattern
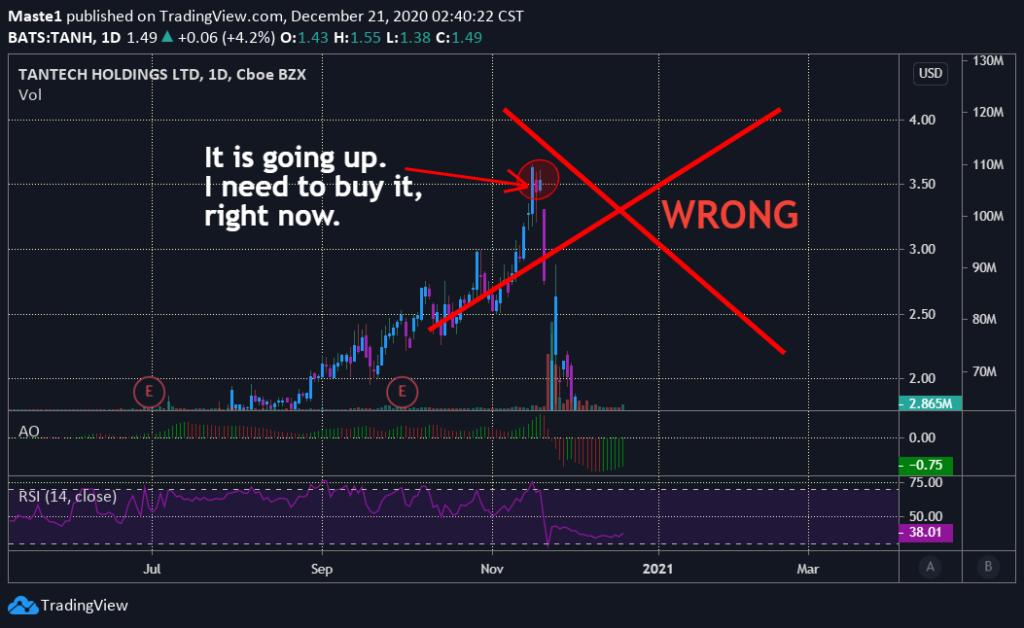
The first requirement for an ascending triangle to occur is the uptrend or downtrend in the price movement. After a stock is bought or sold for a while, people will start taking profits especially once the price reaches the resistance level.
The profit-taking will then cause a pullback or a retracement. After a temporary reversal caused by profit-taking, the price will resume the upward movement and reach the previous high.
Once the price touches and rejects the previous high level, it might be an indication of an ascending triangle being formed. As a trader, you will need to see if the security reaches the previous low. If it forms a higher low (the low formed is higher than the previous low), you can then draw your triangle since you have four main points required for an ascending triangle pattern.
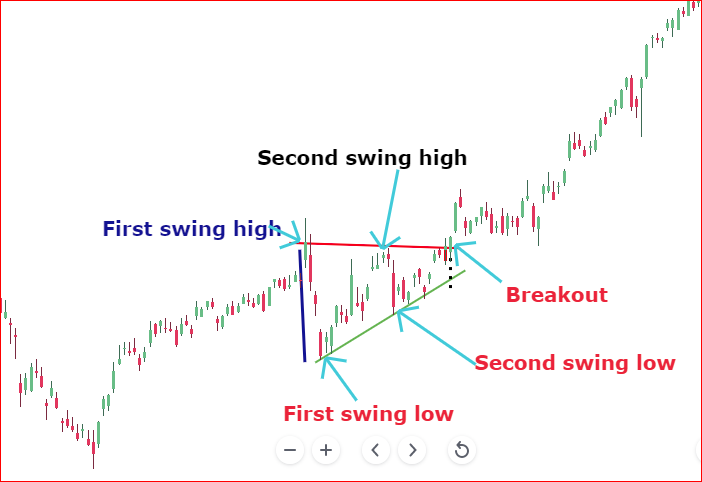
Those main points are the 2 swing highs that end at the same level (resistance level) and 2 swing lows. After drawing your triangle, you will need to watch your stock and wait for a breakout.
3. Trading using ascending triangle pattern
The ascending triangle pattern is very easy to trade. Since it is a continuation pattern, you must expect the breakout to occur in the uptrend for an ascending trend or in the downtrend for a descending trend. Therefore, you would go long if the breakout happens in the uptrend or short the security if the opposite happens.
4. Going long using ascending triangle pattern
The ascending triangle is traded after the breakout. A breakout must occur in the uptrend for you to go long.
Once the breakout happens, you will need a confirmation that the breakout is not a false breakout.
The volume can help you decide if the breakout is real. Many traders watch securities and wait for them to break out of the triangle. When the breakout occurs, traders will heavily buy the stock which will increase the trading volume. If the price moves away from the triangle on high volume, it will be an indication of a high interest in the stock. Therefore, you can confirm that it is indeed a breakout.
Taking a position and using a stop-loss
The position is taken once the price breaks above the triangle. If the volume increases after the breakout, it might be an indication of a real breakout.
However, there are chances that a price will break out at a low volume. This could be an indication of a false breakout. Therefore, you must be very careful when trading this pattern. A low volume shows that traders have no interest in a stock.
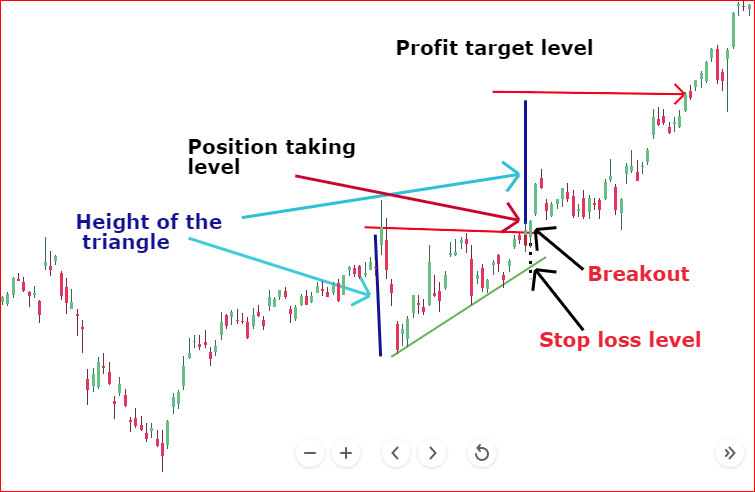
Assuming you did your homework and took a position after the breakout, you must use a stop loss. Your stop loss will be placed on the other side of the triangle. That is on the support line of the triangle. Should the price comes back into the triangle and continues in the downtrend? Your stop loss will kick you out of the market and protect you from major losses.
Some traders decide to put their stop loss under the resistance level. Their idea is that if the breakout is real, the price will not break back under the resistance level. Therefore, a break back under the resistance level could indicate a false breakout. That is why some traders exit the trade right away especially those who have tight stop losses.
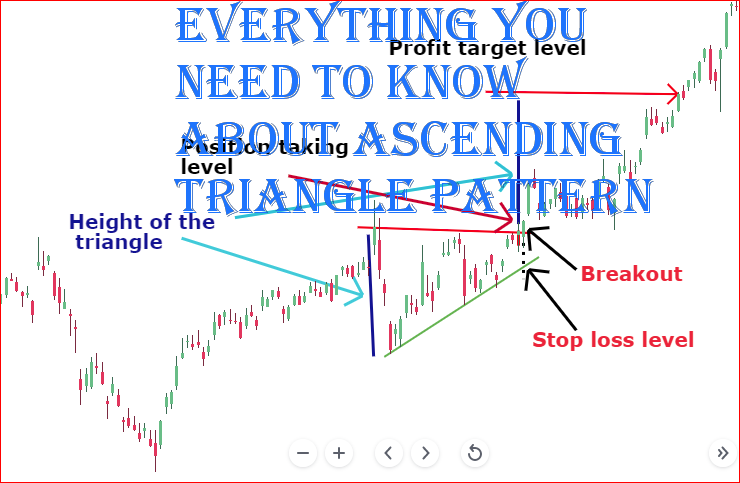
Taking profit when going long
The profit target will be determined by the height of the triangle. Your profit target price will be the breakout price plus the height of the triangle. For example, let’s assume that the breakout price is $30 and the height of the triangle is $6. In this case, your profit target will be $36 which is the sum of your breakout price and the height of the triangle.
5. Shorting using ascending triangle pattern
The ascending triangle is a continuation pattern. Meaning that a breakout will likely happen in the upside of the triangle. However, it is not always the case. Sometimes the price breaks below the triangle. This is an indication of a reversal in the trend or a continuation of a downtrend.
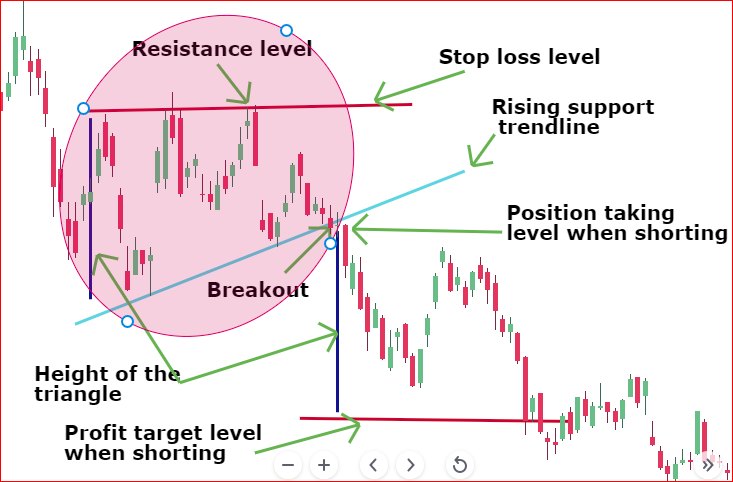
If you are shorting, you will take a position as soon as the price breaks below the triangle. Your stop loss will be on the other side of the triangle. If the price moves back up and breaks above the triangle, it will be a possible indication of a reversal in the trend. The stop loss will kick you out of the market and protects you from big losses.
Taking profit when shorting
The profit target for an ascending triangle is estimated based on the height of the triangle. This means that your profit target will be the breakout price minus the height of the triangle.
For example, let’s assume that the height of your triangle is $3 and the breakout price is $20. In this case, your profit target price will be $17 which is the difference between the breakout price and the height of the triangle.
Note: The ascending triangle can happen in uptrend or a downtrend.
If the triangle appears in an uptrend, the breakout would be expected to be above the triangle. This will confirm a continuation of the trend. Therefore, this scenario is good for going long.
However, if the triangle happens in a downtrend; the breakout will be expected below the triangle. This will confirm a continuation in the downtrend. Therefore, this is good for shorting.
Caution
The ascending triangle is a great continuation pattern. It helps traders to maximize their profits as long as they follow all instructions of the pattern.
Although this pattern is good, nothing is perfect. You must always trade the pattern with caution.
Always use stop losses for every position you take. This will protect you from losses if the stock moves against you.
There is no single trading pattern or indicator that is 100% perfect. Therefore, you should use a combination of many indicators and patterns when assessing the possible direction of the price.