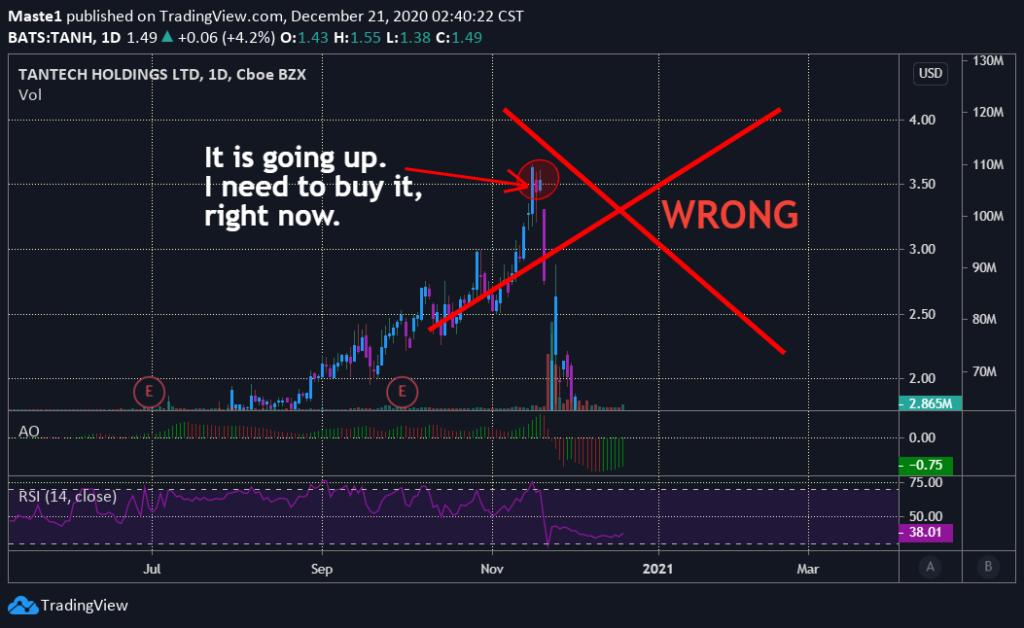
A head and shoulders pattern is one of the most reliable trading pattern used in technical analysis. The trend is made by three peaks with the middle being the highest. The outside peaks are usually at the same level. This pattern is a great indication of trend reversal of a stock or security’s price.
In this article, we will explain in details what a head and shoulders pattern means, how it is formed, and how to trade with this pattern.
Table of Contents
- Understanding the head and shoulders pattern
- Formation of a head and shoulders pattern
- Trading with a head and shoulders pattern
- Bottom line
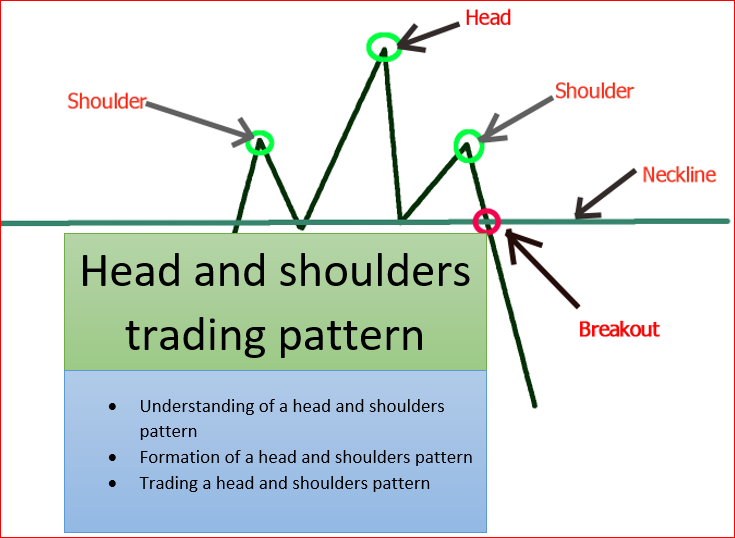
1. Understanding head and shoulders pattern
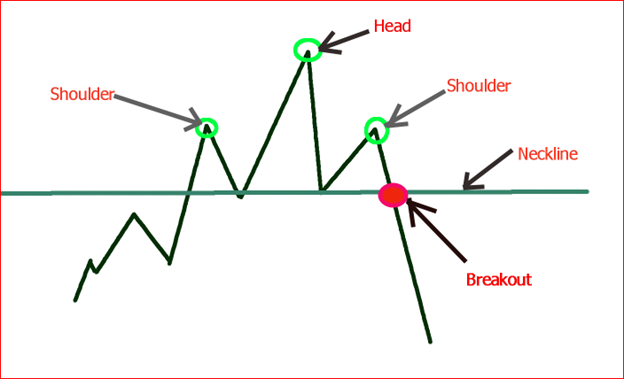
Figure 1, depicts the head and shoulers partern. After a big uptrend rally, sellers take profit and the price retracts to form the first shoulder. Then, buyers push the price back up a little more and break the previous high before retracting to the same base level or neckline. Keep in mind that bulls can still push the price much higher and continue the up trend on the second high(head). The final push in the uptrend makes a high that is at the same level with the first high or first shoulder. By observing the chart formation, the two side highs form shoulders while the middle form a head.
When this pattern happens after a long uptrend, it signals that sellers are taking over and the trend is about to reverse.
This pattern can also happen after a long downtrend or sell off. In this case, it is called an inverse head and shoulders pattern and it signals a possible reversal in the trend. In order words, an inverse head and shoulders pattern shows that buyers might be taking over and the trend is about to reverse.
2. Formation of a head and shoulders pattern
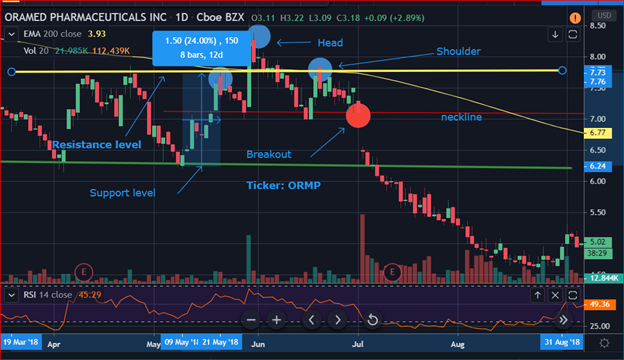
Our price action analysis is going to start from the support level starting from May 2018 on the chart.
Before the first shoulder, the price had a rally of a 24% in the uptrend from the support level. You can also see that the stock had a pullback when it reached the resistance level of around $7.70/share. This pullback was due to sellers who wanted to lock in profit after a 24% rally in case the price reverses at the resistance level. This action formed our first shoulder. After the pullback, buyers stepped in and pushed the price much higher and broke the resistance level.
After the resistance level was broken, the price made a new high at around $8.50 on high volume. However, the bears jumped back into the game and dominated the market again. The price was once again pushed back to the neckline and that created the head. The neckline created a short-term support after the first pullback.
Note that bulls could have pushed the price much higher and continued in the uptrend instead of forming a head. In this case, our first shoulder would become a pullback in a continuing uptrend.
Since the neckline created a support level, we would expect the price to go back up to create a second shoulder or break through the neckline to continue its downtrend.
In our case, buyers stepped back in and bought the stock after it reached the neckline the first time. The price increased and consolidated at the resistance level and did not break through the resistance level. Why? Because this resistance level has been holding for a long time and has proven to be reliable. Therefore, sellers dominated and the second shoulder was formed.
More sellers jumped into the market and the stock was heavily sold. The breakout happened on the neckline. This is was an indication of a downtrend taking place. We got a second confirmation of a long downtrend after our major support level was broken around $6.24/share.
3. Trading a head and shoulders pattern
Since the head and shoulders is a good indication of a downtrend, it is a good pattern to use when shorting. However, you can also go long on the pattern with a little caution.
a. Shorting
Shorting a stock using a head and shoulders pattern requires some attention and understanding of the pattern. Before taking a position in the stock, you will need a confirmation that the stock is indeed taking a downtrend.
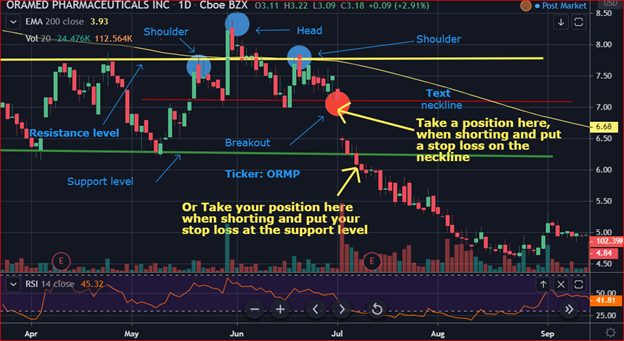
The first indication of a downtrend was revealed when the stock broke below the neckline.
To maximize your profit, you could have taken a position right after the neckline was broken. Your stop loss would be at the neckline or above depending on how much you are willing to lose on the trade. In this case, you would need to probably get out of your position in case our support level holds. Or stay in the position if the support level fails.
The other way to trade this pattern is to wait and take a position once your support level is also broken. This is would be a second confirmation of a continuation in the downtrend.
In this case, you would take a position right after the support level is broken. Your stop loss would be at the support level or above depending on how much you are willing to lose on the trade.
Once you are in the trade, your next job is to watch and analyze the market and price movement. Always prepare to either get out of your position when the price reaches the next support level. You don’t necessarily have to sell all your shares. However, as a trader your job is to lock in profit. Selling some of your shares to lock in profit would make sense. There is a high probability that the stock could reverse the trend once it reaches the next support level.
b. Going long
If you are going long on this pattern you would need a confirmation that the head and shoulders pattern has failed. This means that the price would not break the neckline and we would see a reversal. Bulls would by the stock and push the price back up. To be an actual uptrend, the price needs to break above the second shoulder and then above the head.
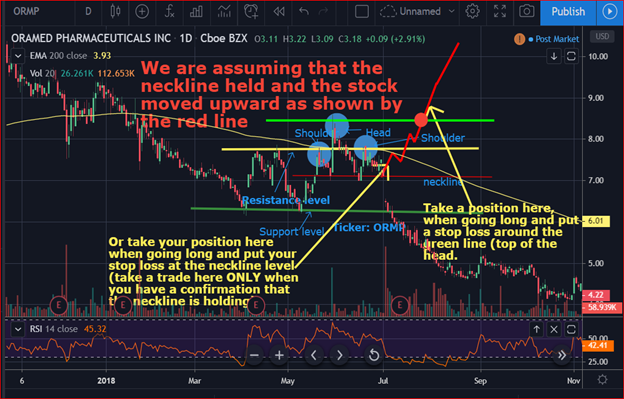
You could take a position once the neckline held and prepare yourself for a quick profit when the price reaches the top of the second should or the top of the head. This is because these levels are resistances and there might be a reversal in the trend when the price reaches them. Therefore, bears could push the price back down after reaching these levels.
However, an actual confirmation of the uptrend would happen when the top of the head is broken (on high volume). You can take a position after the head is broken. Your stop loss can be at the top of the head or a little below depending on how much you are willing to lose on the trade.
When you take a position after the head is broken, you would get out of your position or take profit once your stock shows a possible reversal in the trend or when it reaches the next resistance level.
4. Bottom line
Head and shoulders pattern is a very good downtrend prediction pattern. It is made of three high levels with the middle being higher that the other two. Those little highs are called shoulders whereas the middle high is considered the head.
Like other trading patterns, there are risks involved with trading head and shoulders pattern. Therefore, you must learn the pattern before applying it. In addition, it is equally important to use stop losses for every position you take.