What is accumulated depreciation ratio?
The accumulated depreciation ratio is a financial ratio that measures the percentage of gross fixed assets that have been depreciated. The term depreciation refers to the reduction in the value of an asset over time.
A higher ratio indicates that fixed assets are reaching the end of their usable life, whereas a lower ratio means that assets still have more usable life for optimal production.
How to calculate the accumulated depreciation ratio?
The accumulated depreciation ratio is calculated by dividing the accumulated depreciation over a period of time by the total fixed asset value, according to Profit.co. In other words, this ratio compares the overall depreciation of fixed assets to the original value of the assets in question.


In this formula,
Accumulated Depreciation = The overall depreciation all fixed asset experienced in a given time.
Gross Fixed Asset value = The total value of fixed asset when they were first acquired.
Note: Land is the only fixed asset that is not considered during the calculation of this ratio. This is because land does not depreciate (cannot be used up). For this reason, it is omitted during the calculation of the accumulated depreciation ratio.

Example
A company that manufactures shoes has reported $750,000 in gross fixed asset value. At the same time, the company reported an accumulated depreciation value of $400,000. If the average lifetime of its assets is 10 years and the company has owned the assets for 4 years, calculate:
a) The accumulated depreciation ratio
b) The remaining usable life of its assets
To answer this question, we will use the following steps
Step 1: Available data
- Gross fixed asset value = $750,000
- Accumulated depreciation = $400,000
- The total usable lifetime of assets = 10 years
- The number of years the assets were owned = 4 years
Step 2: Calculate the ratio

The ratio can be expressed as a decimal or a percentage. In our example, we have an accumulated depreciation ratio of 0.533 or 53.3%. This ratio tells you that the assets have used up 53.3% of their total lifetime. In other words, the remaining usable value of these assets is 46.7% or $350,000 (46.7% of $750,000).
Step 3: Calculate the remaining number of years these assets can be used with maximum performance (before they can be replaced)
Since these assets have a lifetime of ten years and have used 4 years already; one can be tempted to say 6 is the remaining number of years. If you are thinking about 6 years, this answer could be a little different from reality.
These assets would last 10 years only if they are operating under normal conditions as suggested by their makers. Depending on environmental conditions, types of tasks, etc. assets tend to outlive their usable life or lose value much faster.
In our example, we found that our assets lost 53.3% of their value in less than half of their usable lifetime. That is if the company continues to use these assets at the current rate, they will not last 10 years.
The question is: If a company’s assets lost 53.4% of their value in 4 years, how many years will it take for them to lose 46.7%?
The following is a more reasonable number of years our assets can be used with maximum output.
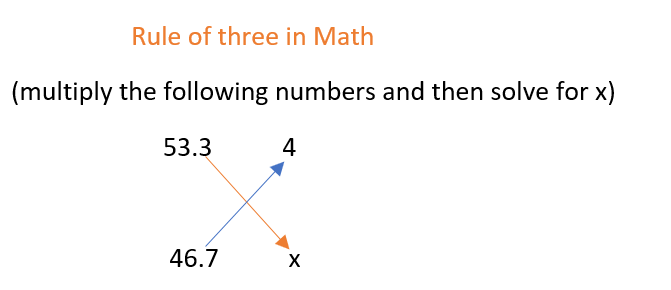
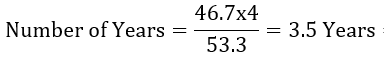
From these simple math calculations, you can see that the remaining usable lifetime of these assets is 3.5 years. In addition, we can conclude that our company’s assets will provide optimal performance for only 7.5 years (4+3.5) instead of 10 years. A low usable life can be due to many reasons.
When assets’ values become zero ahead of their predetermined usable lifetime, it indicates some of the following:
- Assets’ lifetime could have been overvalued ( their quality does not fit the estimated usable lifetime)
- Assets have been overused
- Or assets were used for tasks beyond their primary designs
Why does the accumulated depreciation ratio matter?
As a company, it is important to keep up with the lifetime of all assets the company owns. This helps in planning and budgeting.
In other words, the accumulated depreciation ratio tells a company the number of remaining usable value of their assets and the number of years until they are replaced. With this information in mind, a company can make proper adjustments to the budget ahead of time to avoid delays or accidents due to broken equipment.
Investors can also use this information to know where a company stands in terms of assets. For example, investors can avoid a company that needs to replace its expensive assets in order to stay in business. This is because the company’s profitability could be hindered by debt accumulation if the company finances the purchases with debt.