What balance of power indicator?
The Balance of Power indicator is a technical analysis oscillating indicator that measures the strength of buyers and sellers in the market, according to Tradingpedia. This indicator was invented by Igor Levshin in 2001, according to StockCharts.
The rule of the market is that buyers push prices up whereas sellers push prices down. If you have more sellers (more supply) in the market, the price will go down. On the other hand, prices move up when buyers are dominating the market (more demand).
As buyers and sellers exchange stocks and other tradable securities; the balance of power indicator measures the strength of buyers and sellers in pushing prices up and down, according to Interactive Brokers.
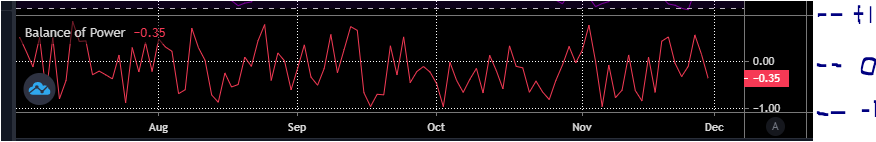
This indicator oscillates between -1 and 1 where -1 shows that the stock opened at a high value and closed at a low value in the trading period chosen.
On the other hand, a +1 value indicates that the stock opened at a low value and closed at a higher value in a given trading period.
The center of the interval is 0 and it indicates the shift in market sentiments. For this reason, investors use it for buying or selling opportunities.
That is when the indicator crosses the zero line from negative to positive territory, investors consider it as a buy signal. On the other hand, if the indicator crosses the zero line from positive to negative territory, investors consider the move as a sell signal.
How to calculate the balance of power indicator?
The simplest way to calculate the balance of power is to use the close, low, open, and high prices.
As noted by trade of the day, the following is the formula of Balance of Power indicator.
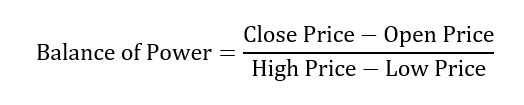
In order to eliminate spikes and smooth the data, a moving average is used.
What are the use of Balance of Power Indicator?
Investors and traders use the Balance of Power indicator to understand the general performance of the market. If used properly, it can show who is in charge in a particular market at a given time.
The following are some of the use of the Balance of Power.
- The indicator can help to identify the convergence and divergence of prices
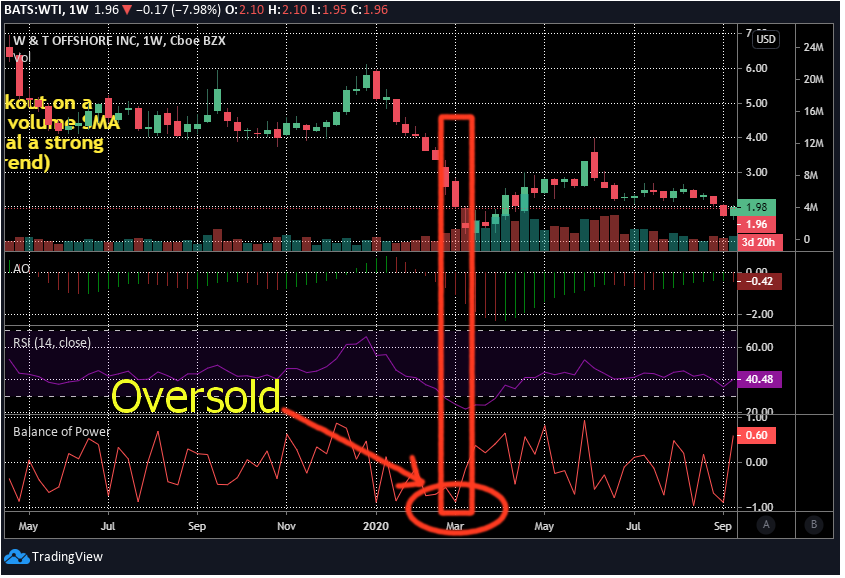
- It can show when stocks and tradable securities are oversold or overbought. This can help investors to know whether they can buy or sell. For example, if a stock is overbought, traders can take profits or short the stock in an anticipation of a downtrend. On the other hand, if a stock is oversold, investors can take long positions or buy to cover their shares in an anticipation of a strong rebound.
>>Related: Relative Strength Index(RSI): What Is The RSI?
- It can help to identify trends
Note: Investors and traders should not rely only on this indicator to make investing decisions. This is because there is no single indicator that can give accurate information about prices and movements in the market.
For this reason, it is always a good idea to use other trading indications, volume, support and resistance levels, and trading patterns in a conjunction with the Balance of Power.
These trading strategies help to confirm price movements and guide investors in making proper investing decisions.