Investing in short-term equities or day trading requires the mastery of technical analysis. In simple terms, technical analysis is the strategy of predicting future price movements of equities, such as stocks, using statistical analysis of historical data. The balance between supply and demand dictates the share prices of securities. More demand pushes prices higher, while more supply pushes prices lower.
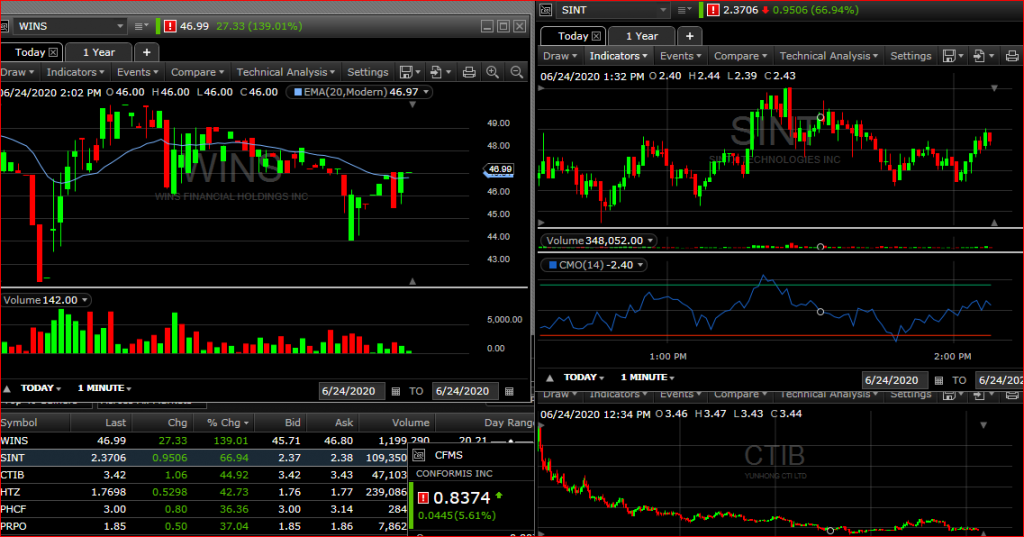
You can use technical analysis to predict whether the demand for a particular stock or market is increasing or decreasing. As a trader, you mainly rely on price and volume data to predict future stock prices and when it makes sense to enter or exit a position. Most common technical analysis strategies include but are not limited to volume, patterns, support and resistance, indicators, oscillators, and moving averages.
In this article, I will cover the basics of technical analysis and explain some of the most common technical analysis strategies.
What Is Technical Analysis?
Technical analysis is a field that focuses on analyzing and predicting the future performance of stocks and other securities using historical data, trading volume, chart history, etc. The philosophy behind technical analysis is that if you can identify patterns and trends in past data, you can use that information to predict future movements of equities. Learning technical analysis is essential whether you are day trading or swing trading.
Long-term investors can also use technical analysis when deciding when to take positions. For example, in a bear market, technical analysis can help you decide whether stocks have bottomed up or if it is too early to buy equities.
Technical analysis is entirely different from fundamental analysis. In fundamental analysis, investors attempt to predict future company performances based on financial reports, earnings, ratios, and economic and sector performance factors.
Technical analysis does not consider fundamentals. It only focuses on statistical analysis, chart movement, and the volume of past data.
In this article, I will cover the basics of technical analysis and how to use its principles to analyze stocks when day trading, swing trading, or short-term investing.
Technical analysis strategies
Mastering technical analysis can be difficult due to dozens of patterns and indicators. There is so much to learn to master technical analysis. However, the main focus includes price trends, volume and momentum indicators, chart patterns, oscillators, moving averages, support, and resistance. The good news is that you don’t necessarily need to know everything about technical analysis to become a successful trader or investor. The following are the most important things to learn in technical analysis.
1. Chart Patterns
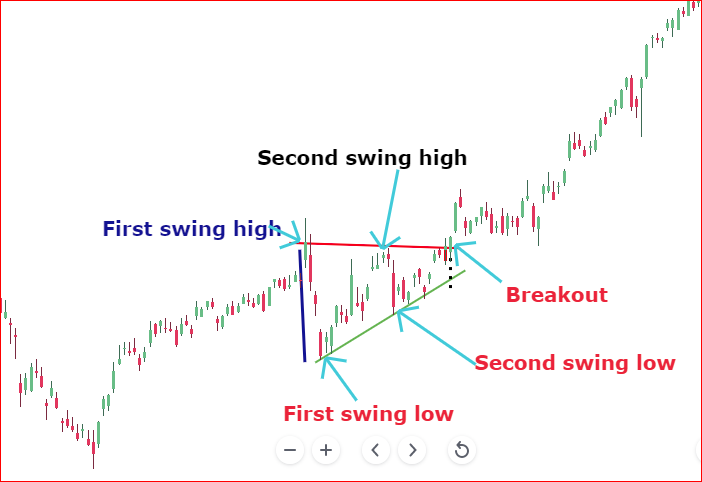
Short-term and long-term traders and investors use chart patterns to predict the future price direction of stocks and other tradable securities. As the price fluctuates over time, traders identify formation on the chart by drawing lines that connect different price levels. From there, they can identify the possible direction of the stock.
2. Moving Averages
Moving averages are statistical methods that smooth data points by creating a series of averages from the main data set. This method is widely used in the stock market to help traders understand stock price movements.
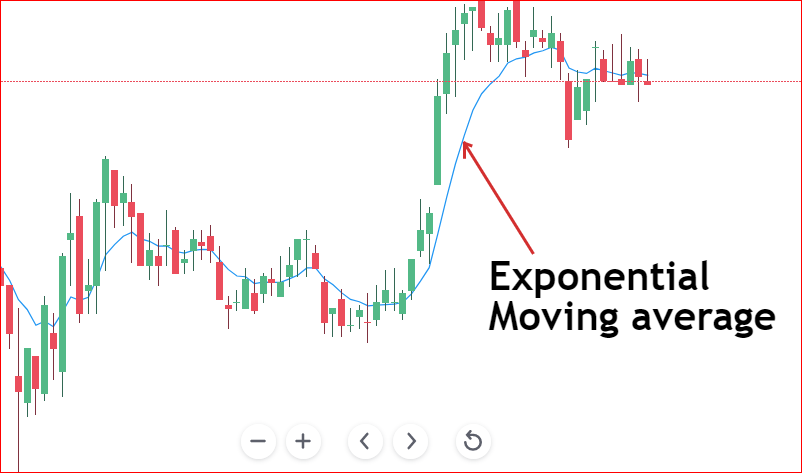
There are many types of moving averages, such as Simple Moving Averages (SMA), Exponential Moving Averages(EMA), and Weighted Moving Averages(WMA). Traders use them based on their trading needs and strategies.
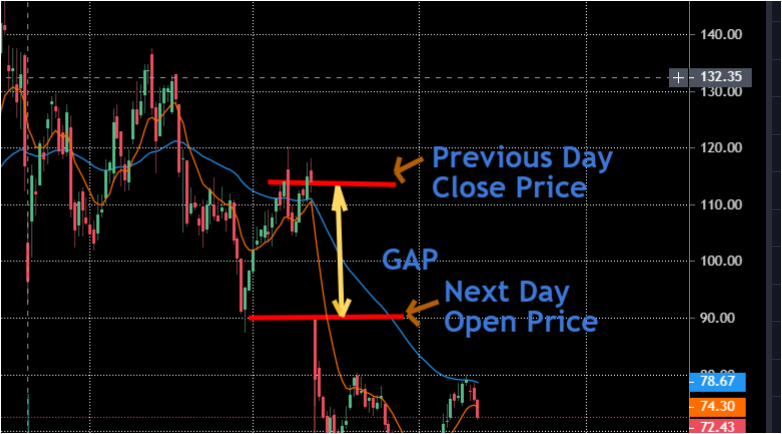
3. Support and resistance levels
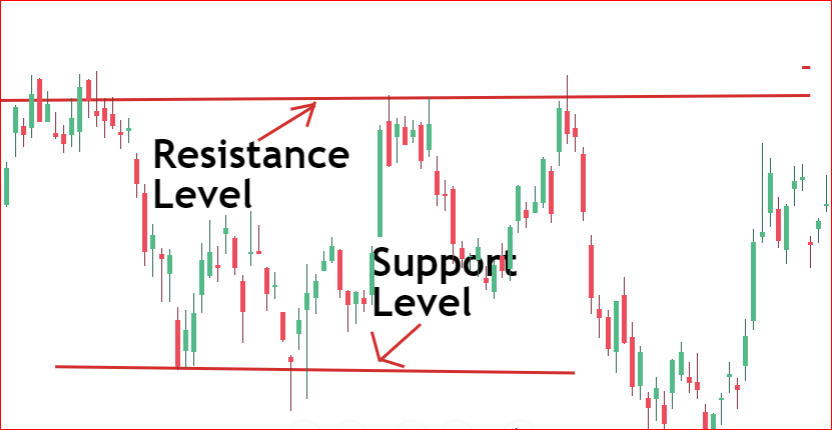
In technical analysis, support and resistance levels are key information to spot when analyzing stocks. New traders and investors usually find it difficult to find these levels on a chart. Support and resistance levels also change based on the time frame a trader is using. Basically, a support level that exists on an hourly chart may not be there on a weekly chart.
In short, these levels act as barriers to securities’ prices. They prevent a price from breaking above or below a particular level.
A support level prevents a stock price from breaking below it, while a resistance level prevents the stock from breaking above it.
4. Volume and momentum indicators
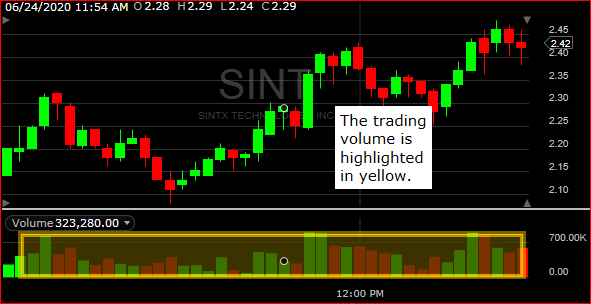
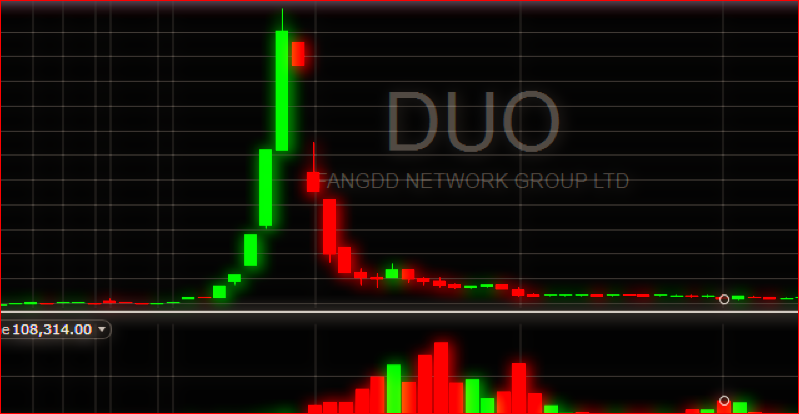
Trading volume is used by all kinds of traders regardless of their trading strategies. Whether day trading, swing trading, or buying for the long term, trading volume will help you forecast the stock’s future price.
Understanding the number of shares bought or sold at a particular time can help you predict the next stock movement.
For example, if the buying volume and momentum increase on good news, you will know the price has a higher chance of increasing. You can trade this stock using your favorite trading strategies based on this information. In other words, you can either take a long position in the stock or cover your short-sell position to prevent losses.
5. Price trends
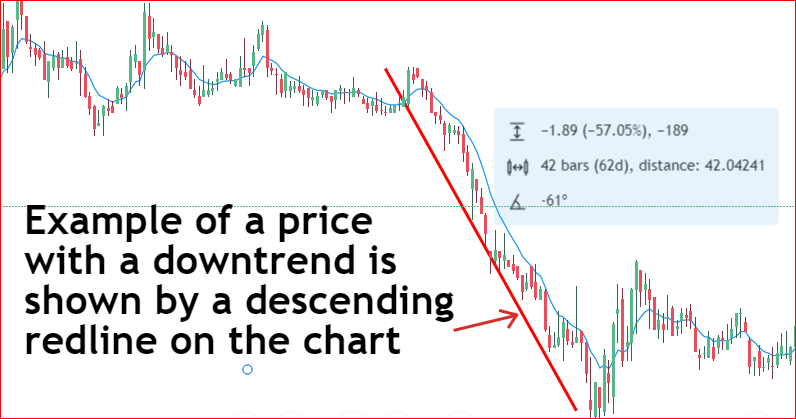
The price trends indicate directions in the price of stocks and other assets. If a company is not doing well, its stock price will decline. During this period, we will say the price has a downward trend.
The same thing could happen if a company is doing well financially. The price can increase over time. In this case, we will say that the price has an uptrend.
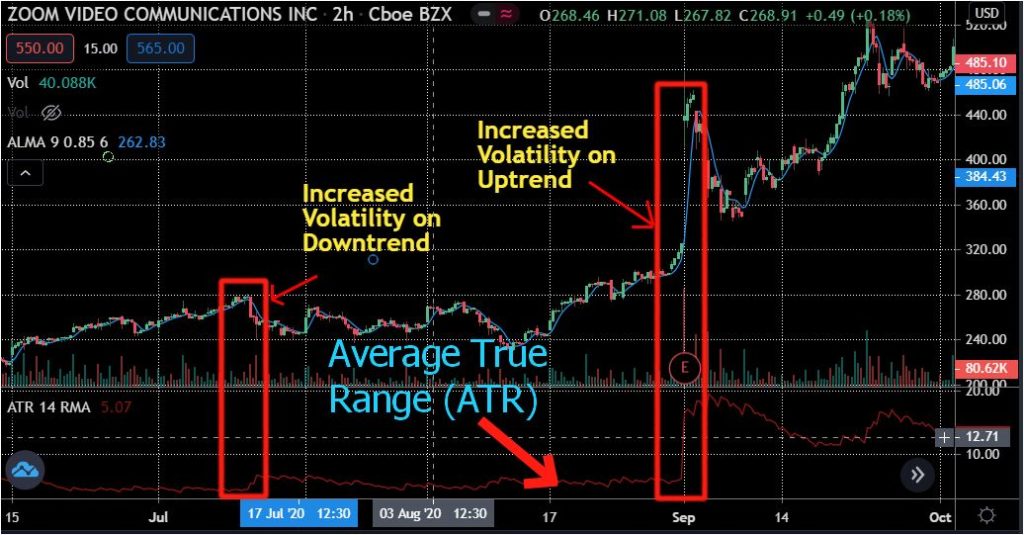
6. Oscillators
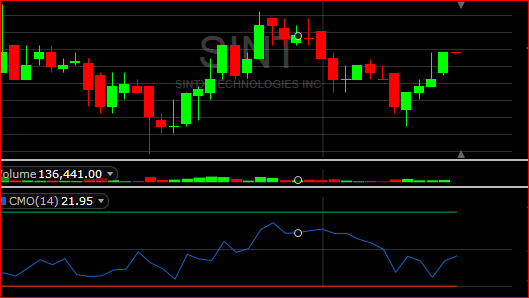
Oscillators are indicators that draw bands between the highest and lowest price levels. At the same time, oscillators build a trendline that stays between these bands. Traders can make sense of stock movements based on how the trendline behaves between these levels.