The advance-decline line a.k.a AD line is a breadth indicator that calculates the difference between the advancing stock and the number of declining stocks, according to StockCharts. This difference is also known as the net advance.
The net advance will be positive when the number of stocks that are advancing is greater than the number of stocks that are declining. On the other hand, the AD line will be negative when the number of declining stocks is greater than the number of advancing stocks. Investors can use the advance/decline on a chart to compare a particular stock or index with the rest of the market. They can also use this line to understand the general performance of the market as a whole.
For example, investors can use the AD line to compare the performance of Nasdaq vs stocks that are trading on Nasdaq. The information investors gather from the AD line will then help them understand how particular stocks are contributing to the rise or the fall of Nasdaq.
This indicator is an accumulative indicator.
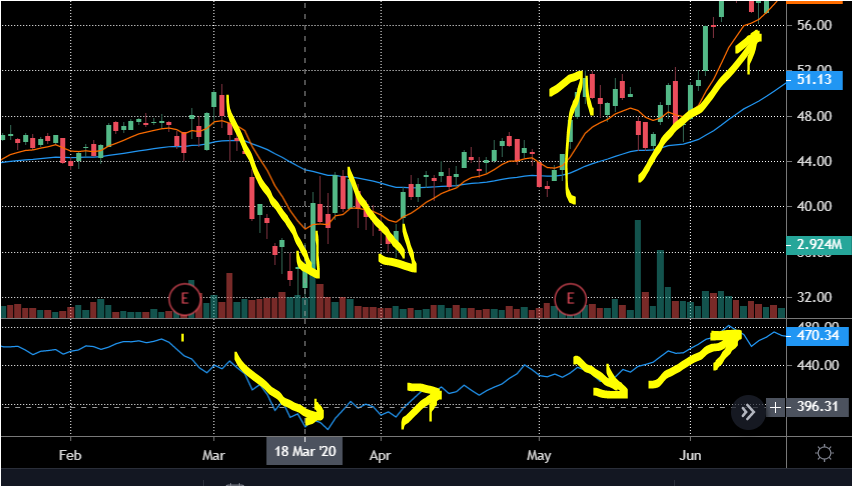
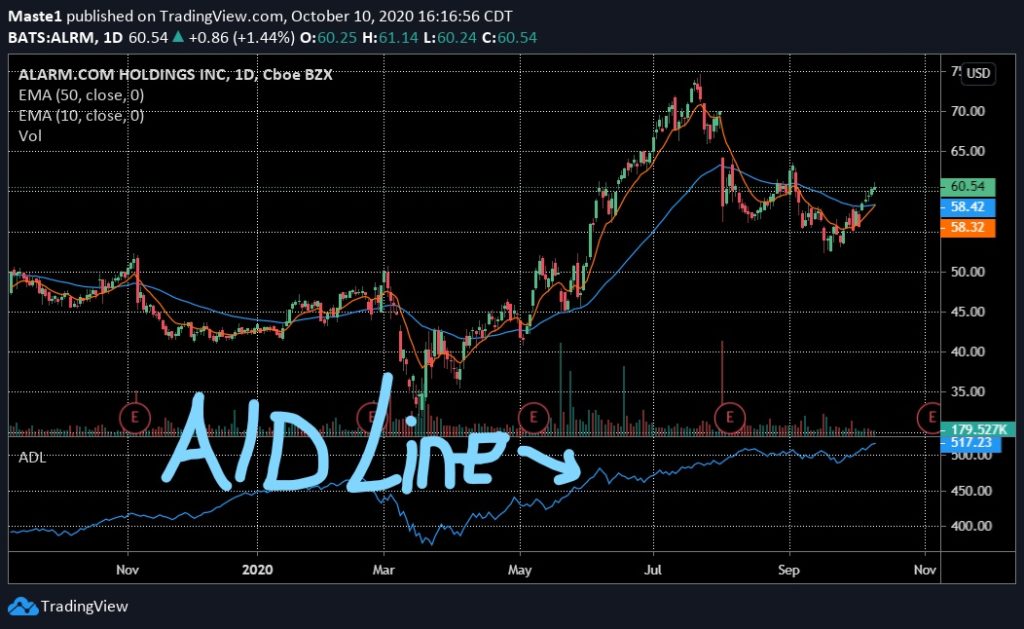
The A/D line does not follow a particular stock. As you can see from the figure above, there are times when the stock price was declining whereas the line was increasing. The line simply shows you what the stock is doing compared to the market it is in. It also shows you whether the stock is contributing to the market rise of decline.
How does the A/D Line works?
The current AD value will be based on the previous AD line’s previous value and the current net advance, according to StockCharts.
AD Line = Previous AD line value + Current Net Advance Value
The A/D line helps investors in understanding what the market is doing. For example, if the AD Line continues to decline together with its index, it will be an indication of strong participation in the decline. As a result, the market will be signaling a bearish move.
Benefits of Advance Decline Line
The AD line helps investors to understand the performance indexes and market in general by analyzing stocks in the indexes. If the markets are declining or rising, investors can tell how many stocks are contributing to the decline or rise. This information gives investors insight into the market and alerts them for a possible market correction or a pullback.