What is Simple Moving Average?
A simple moving average (SMA) is a statistical measure used in technical analysis to smooth data for easy interpretation of the trend.
This is the simplest form of moving averages. It is calculated by adding data points in a given time period and then dividing the sum by the number of periods in it.
According to fidelity investment, the average is called moving because it is plotted on a bar chart and forms a line that lags behind the chart value as the averages change.
How to calculate SMA?
Basically, the simple moving average is the sum of data points in a time period divided by the number of periods.
For example, let us say that we want to know the moving average of stock for a length of 10 days. That is, the length is ten and each period will represent one day. In this case, we will need the stock prices for ten days. Let us assume that the stock price per share over the last 10 days were: $1.2, $1.4, $1.9,$1,$1.8,$2,$1.1,$1.4,$1.45, and $1.6. We will use the following formula to calculate the average of these prices.
Simple moving average formula
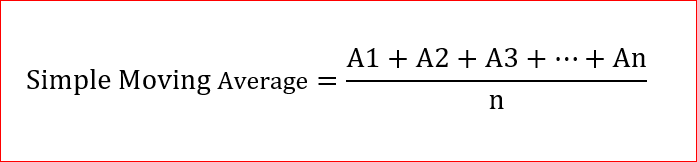
Where,
A1, A2, A3, and An represent the prices of an asset over a length n. That is A1 is the first price, A2 is the second price, …, and the An is the last price in the interval.
n represents the time interval.
In our example, the period n =10, and we have prices for each day. What we need to do is plug these numbers into the formula and calculate the average.
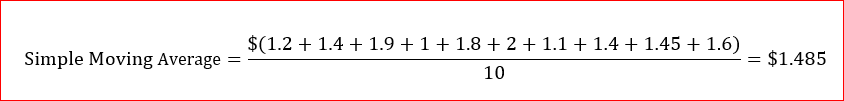
This means that the average price of the stock over the last 10 days is $1.485 per share. To calculate a moving average of a period of 10 on a stock chart, we will need to average the prices every 10 days and plot the average price on the chart.
Over a period of time, we will see a line that lags behind the bar chart which represents the average prices of a stock every 10 days.
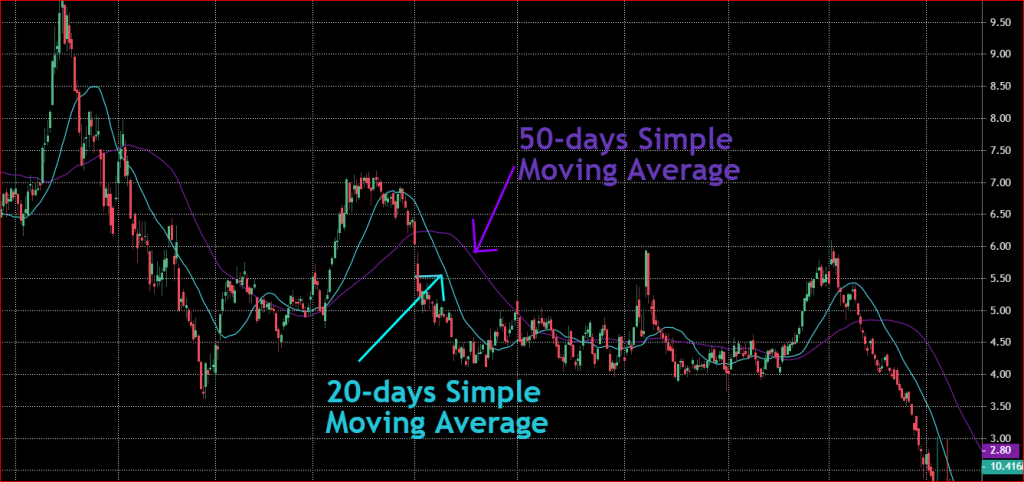
Observation of a simple moving average on a chart
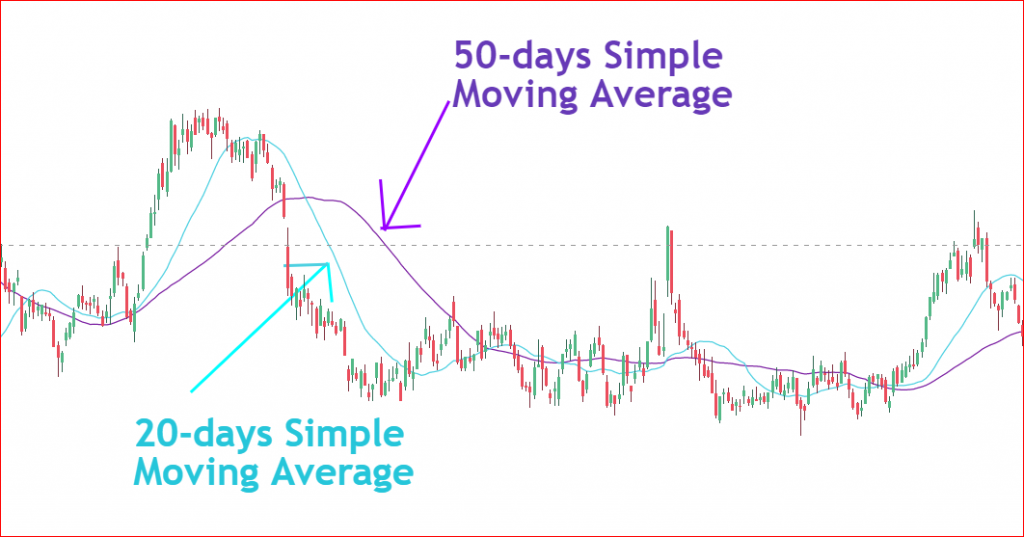
As the length decreases, the line will be closer to the actual prices. This is because there is no big fluctuations in prices and therefore, the average price will be closer to actual stock values. You can observe this on the 20-days moving average. The line is closer to the chart values.
On the other hand, the line will be plotted further from the data points as you increase the period. You can observe this scenario for the 50-days moving average.
In other words, for every 50 days, we are averaging their prices and plot them as one point. The fluctuation in prices at this time period is much higher compared to what we had on a 20-days moving average.
The point is: as you increase the period, the data will be more smother. Keep in mind that you will be missing some details for a higher period.
Benefits of simple moving average
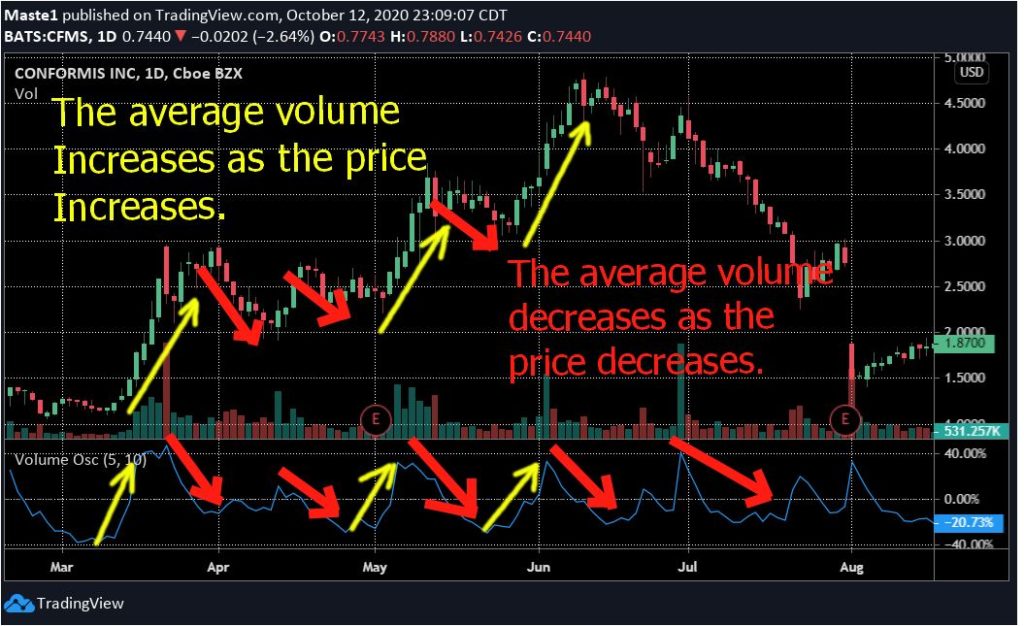
The SMA is very important as it can help you recognize the trend in prices. From Chart 1 depicted above, you can see that the price’s trend was up when the moving average was pointing up. At the same time, the SMA pointed down when the prices were declining.
The moving average will be below the price bar chart on an uptrend and above the chart values on a downtrend. You can observe this scenario in the above charts.
Some traders use the simple moving average as support level and resistance level. That is if a price rejects the SMA, it could be an indication of a reversal in the trend. Or if the price breaks above the moving average it could be an indication of a further uptrend. Based on this information, you can take or exit a position in a stock.
You can also use multiple SMAs to know when the trend is about to change as follow:
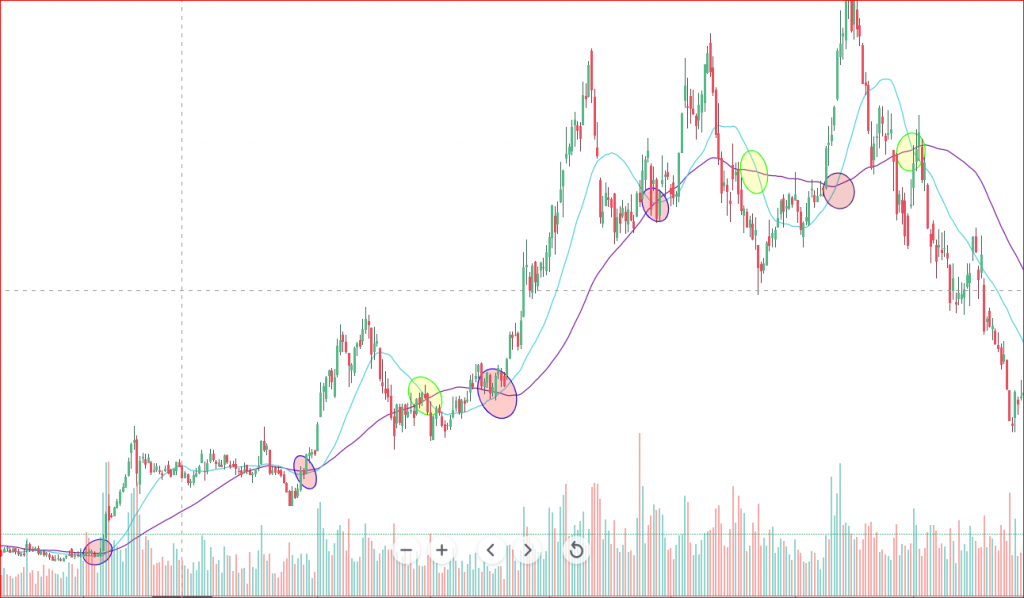
When a long term SMA breaks above the short term SMA, it is an indication of a downtrend. At the same time, when a short term SMA breaks above a long term SMA it is an indication of an uptrend.
You can see this information in Chart 2 above. Red circles represent areas where the short term SMA broke above the long term SMA. The yellow circles represent the location where the long term SMA crossed above the short term SMA.
Final Words
There is no single indicator that is perfect. Market prices and movements cannot be predicted a hundred percentage. Therefore, you must use a combination of many trading strategies to help you confirm a trading decision you are about to make.
This applies to simple moving averages as well. They can help you recognize the trend in price. However, they are not perfect, and therefore, you must use them carefully.
As always, invest only what you can afford to lose.
Happy trading and investing !