What is Fibonacci Rectracement?
Fibonacci retracement is a technical analysis tool that is used to show locations where support and resistance levels will most likely take a place, according to Investopedia. This tool plots the retracement lines in terms of percentages which are based on the Fibonacci sequence.
The Fibonacci retracement levels are drown at the following percentages: 0.0%, 23.6%, 38.2%, 50%, 61.8%, and 100%.
Traders and investors use these levels to understand where they can take positions or exit their trades. Furthermore, investors can use these levels to decide how to trade a stock. For example, if a stock is showing a strong downtrend movement at a Fibonacci level, an investor can take a short position. At the same time, a trader can take a long position when a stock is showing a strong uptrend movement at a Fibonacci retracement level.
How do prices move within the trend?
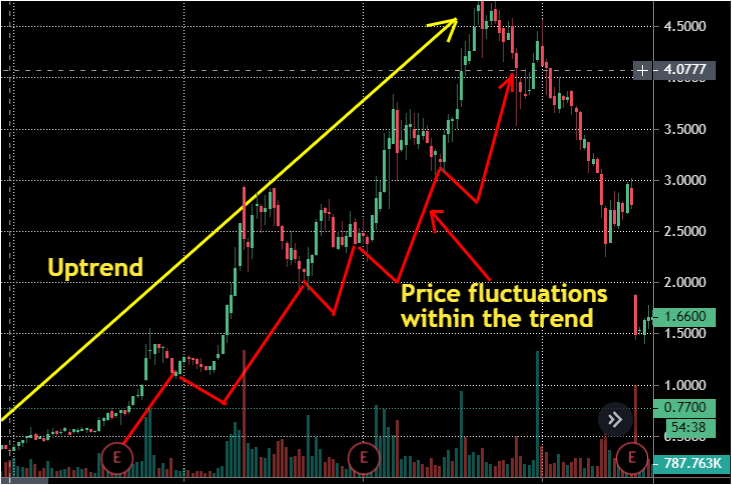
Prices of assets such as stocks and other tradable securities do not follow a trend in a straight line. This is because the price fluctuates up and down due to the buying and selling processes of its shares.
In Figure 1 depicted below, you will see that the price moved up and retracted a percentage of the previous growth before it continued in the original trend (uptrend).
After a huge rally, some investors decide to lock in profits by selling all shares they own in a company or by reducing their position sizes. As a result, there will be more supply than demand. When the supply becomes more than the demand, prices move down. So, more sellers will cause a reduction in the price of the security.
Temporarily retracements within the trend are called pullbacks and they are caused by profit-taking. This is means that for a very rally, the price will retrace back a percentage of its rally before it continues in its original trend (uptrend or downtrend). This process will continue until the price reverses the trend.
The trend reversal will be caused by more sellers than buyers. Everything that goes up always comes down. There are times when the security will become too expensive and investors decide to sell instead of buying more shares. This will cause a wave of sellers and crash the price. This will mark the beginning of a downtrend.
As the price goes down, it will still retract a percentage of the drop before it continues the downtrend. This process will continue until the price reverses the trend again.
How does the Fibonacci retracement works?

The Fibonacci retracement will divide the high and low price levels into different retracement levels in a given time period. These levels [23.6%, 38.2%, 50%, 61.8%, and 100%] will show locations where the support and resistance levels have more chances to occur.
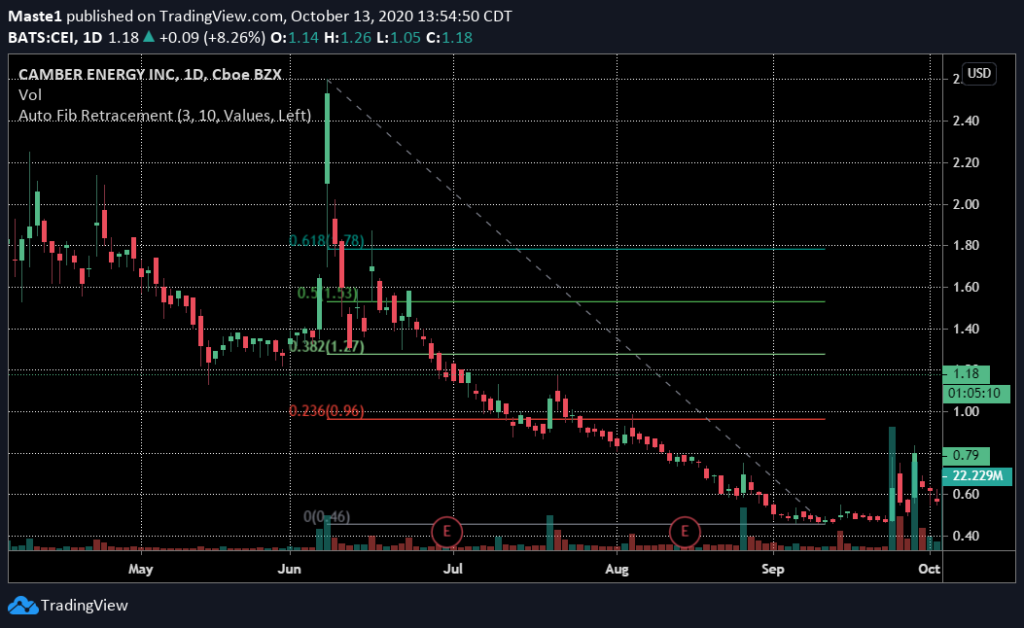
The Fibonacci retracement levels will be shown by horizontal lines drawn at each level as shown in Figure 2, depicted above. The user can choose levels where they want to draw the Fibonacci retracement. After choosing the high and low prices or levels; the retracement levels will be drawn automatically by the trading software you are using (most charting software will have this tool).
Some trading software have Auto Fibonacci retracement. This tool will automatically do everything for your. The only thing you will need to do is to select this option from your trading platform.
These levels are percentages of the prices a trader selects. For this reason, the Fibonacci retracement is subjective. That is the results and observations from this indicator will vary from one user to another.
How to use Fibonacci retracement?
The Fibonacci retracement will help you figure out possible locations of resistance or support levels. For example, one of the most popular retracement levels is 61.8% which is sometimes rounded to 62%.
When the price consolidates at this level and rebounds on an uptrend; investors see it as an indication of a possible continuation in the trend. Investors who want to take long positions, for example, they buy after the price held and bounces above the 61.8% level on high volume. At the same time, they put their stop-loss orders on 61.8%. This is because the price could be heading into a downtrend if it returns back to this retracement level.
In addition, investors who shorted the stock before the pullback end their position when the price bounces at the 61.8% retracement level on an uptrend. Keeping their short positions could be a risky move since the price will most likely break above its previous high level.