What is support?
A support level is a price level where a stock or another asset price does not break below for a while. This level indicates the weakening of sellers’ momentum. It also indicates that buyers have entered the market and could soon take over to reverse the price trend of the asset.
You can summarize support levels as levels where the demand increases which stops the price from going much lower. This is the opposite of resistance levels where prices of stocks and other tradable assets cannot break higher for a while.
For example, a stock becomes cheap after a major sell-off. A cheap price will motivate buyers to jump into the market which will reduce the seller’s momentum.
It is easier to use the concept of supply and demand. When products are expensive, there is less demand. Less demand motivates sellers to reduce the price. Once the price reaches affordable levels, the demand increases which pushes prices back up.
Table Of Contents
- What happens when the price reaches the support level?
- What can you learn from support levels as a trader?
- Types of support levels (Horizontal or slant)
1. What happens when the price reaches the support levels?
When the price reaches the support level three things will happen.
- The price will move back up if there are enough buyers to dominate the market
- The price will consolidate and then move back up
- There will be a consolidation and then the price will continue a downtrend
1. The price will move back up right away
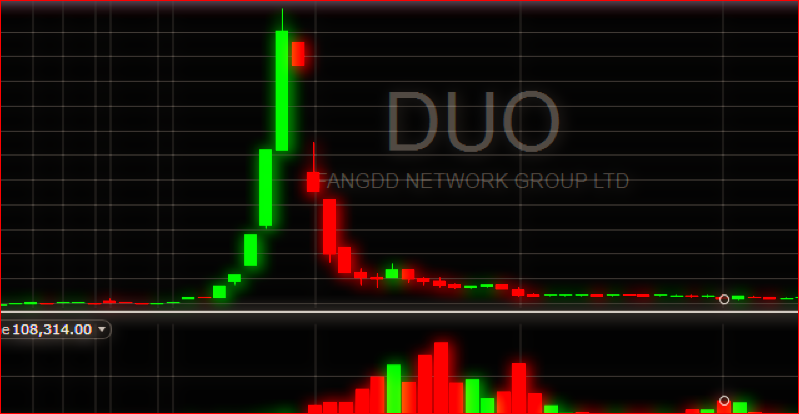
After a major sell-off, the price of the stock will become cheap. This will motivate a lot of buyers to want to own the stock. If there are enough buyers in the market, the stock will reverse the trend without a noticeable consolidation. Please, look at Figure 1 below for at support level without consolidation.
This scenario usually happens when a stock experiences a major sell-off that happens in a very short period of time.
For example, during the coronavirus pandemic, most stocks were down more than 50%. Even good stocks like Apple, TSLA lost a big percentage during this pandemic.
There was a big panic in the market which triggered a major sell-off that lasted a few weeks. By the end of the sell-off, good stocks were really cheap to a level where everyone wanted to own them.
Stocks were on sale. Buyers jumped into the market and pushed prices back up without consolidation.
2. The price will consolidate and then move back up
The second scenario happens after a major sell-off as well. Once a stock reaches a support level, there will be a remarkable consolidation in the price. That is, the price will not move up or down. Sellers and buyers will keep exchanging shares around that level.
You can think of this scenario as a standoff between buyers and sellers. There will be no clear direction for the price. Sellers can’t push the price much lower and buyers cannot push the price back up.
The consolidation can last days, weeks even months before the price moves back up. Please, observe this scenario in the following chart depicted in Figure 2 below.
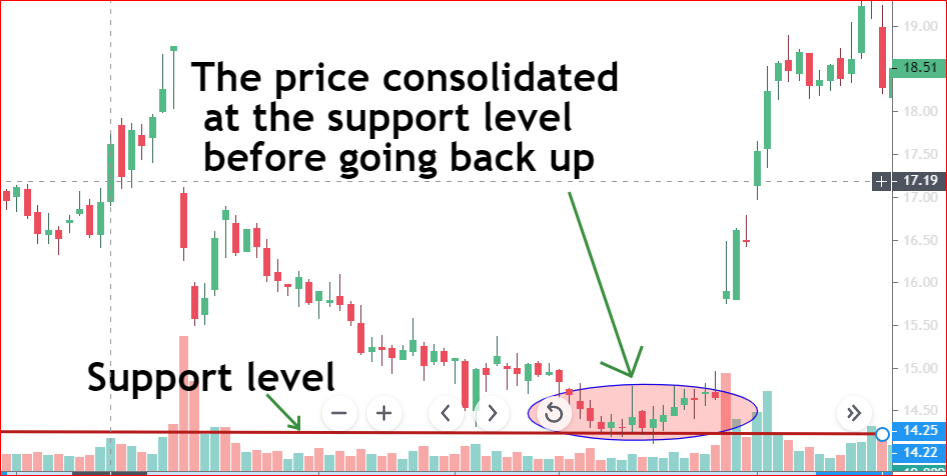
During the consolidation period, there are not enough buyers to push the price back up. You can tell that there are not enough buyers and sellers in the market from a low trading volume. The price will continue to trade at that level until there are enough buyers to push the price in an uptrend.
Some of the reasons buyers can increase are but not limited to the following.
- The good news about the stock such as good earning, FDA approval, merging, etc
- There is good news in the sector of the stock
- Competitors of the company gave up
- A good news for economic recovery
Usually, the volume will increase once the price breaks above the consolidation level and it may be an indication of a long uptrend. Try not to buy when the price is consolidating. The price can still go down.
You can take a long position when the price breaks above the consolidation level of a high volume.
In addition, put your stop loss at the lowest price of the consolidation. If the price breaks below this level, it will be an indication of a further decline.
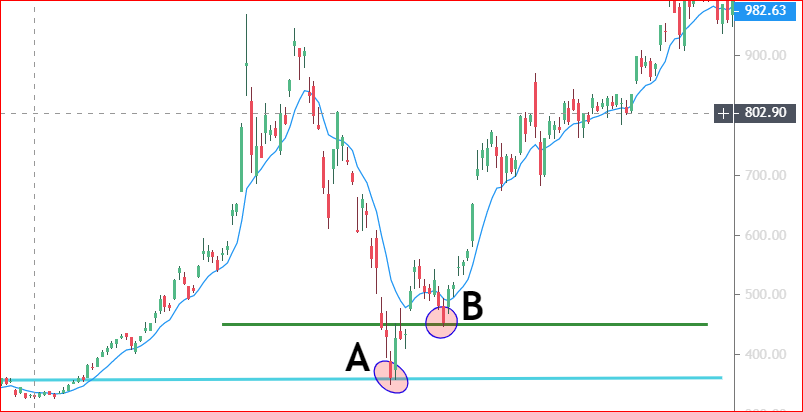
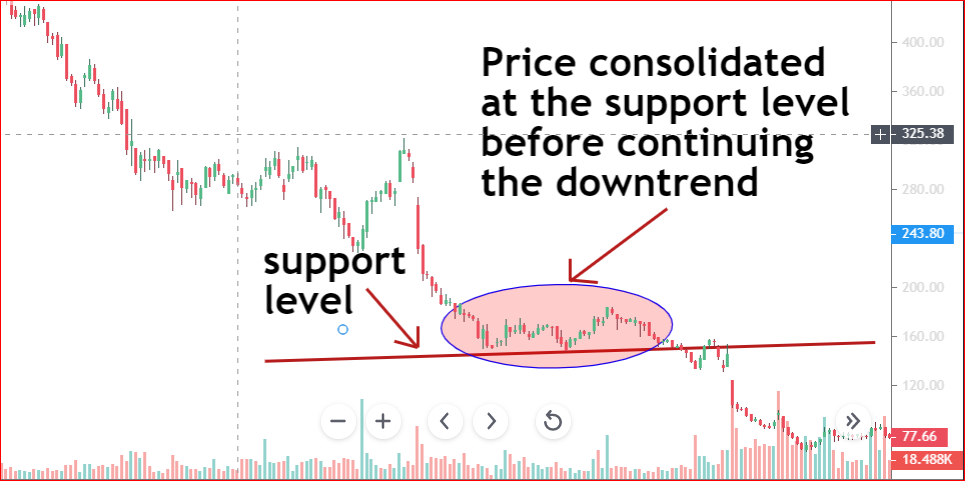
3. The price will consolidate and then continue the downtrend
Last but not least, when the price reaches the support level, it will consolidate before continuing in the downtrend.
The temporary halt of the sell-off is due to buyers who jump into the market and start buying the stock. Some buyers think that the stock price reached the bottom.
The consolidation period can be interpreted as on option number two. Sellers lose the momentum to push the price much lower. On the other hand, there are not enough buyers in the market to push the price back up.
So, the stock will consolidate for days, weeks, even months until there are enough sellers who then push the price down to make new lows.
Please, observe this scenario on a chart depicted in Figure 3 below.
The price will break below the support level when sellers dominate buyers. The reason for the increase in the selling momentum at the support level could be some of the following.
- The company had missed on earnings
- Bankruptcy announcement
- There was no clear guidance from the conference call
- FDA rejected their drugs proposal
- Political attacks due to the lack of privacy
- Bad economic conditions
- A pandemic like Coronavirus
- Its sector is not doing well
- The companies products are proven to be harmful
- Etc.
2. What can you learn from support levels?
The support levels will indicate locations where more buyers are expected to enter the market. Given this information as a trader, you can get ready to take a position after the stock price reaches and rejects the support level.
With more buyers in the market on high volume, the price will probably move back up.
On the other hand, more buyers in the market will freak out short-sellers. For this reason, support levels will indicate possible locations where short sellers will start taking profits.
This is because when short selling, you only make money when the price goes down. So, more buyers at the support level may reverse the trend which will reduce your profit or put you in a loss.
You can use the following tips to know where the support level is or will be on the chart. Remember it is easy to tell where the support will be by using the historical performance of the stock.
- The level where there was a support level in the past. The stock will most likely create a support level at the same level where it had support in the past.
- The previous resistance will act as a support when the price is going down
- Look for areas where the stock was rejected in the past and the stock moved away from that level fast
- Look at the most recent support levels. The price will most likely have support at the same levels.
- Identify locations on the chart where the stock had or is having multiple rejections
- Also, try to find a location where a stock has support and resistance at the same time
3. Types of support levels
Although there are many levels where a support line can be drawn, you can summarize support levels in two forms. The first is a horizontal support level and the second is the slant support level.
Both of these support levels prevent the price from going lower.
Horizontal support levels
Horizontal support levels happen at a horizontal level after a big sell-off. Some examples of this type of support can be seen from the figures we used above. Check out an example of a horizontal support level in the following chart depicted in Figure 4.
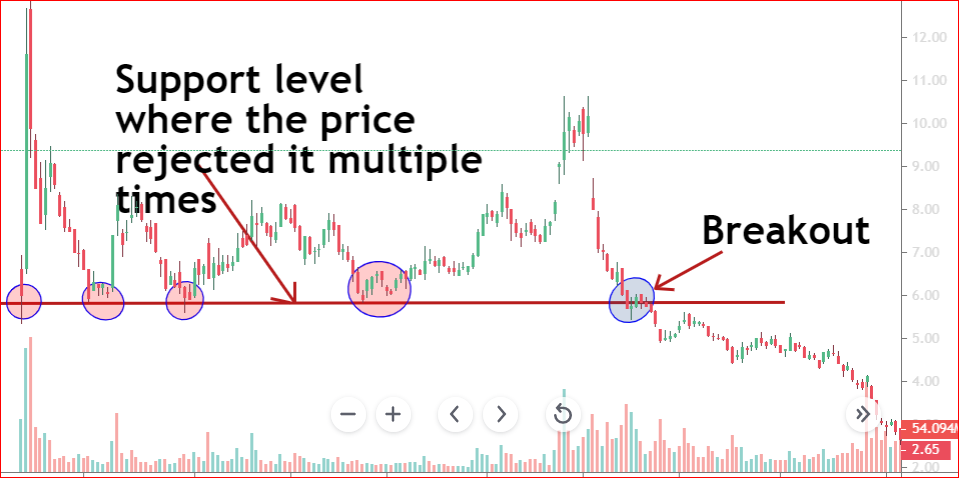
A support level can act as a support for one time or multiple times. That is the stock price can reject the same position many times, as seen in Figure 4.
Slant support or trendline level
Slant support is a line that follows the trend of the price movement. Some traders call this support level a trendline. The price will move up and retrace back until it reaches the trendline or support line. Once it reaches the support line, it will reverse and continue the uptrend.
You can see this scenario in Figure 5 depicted below.
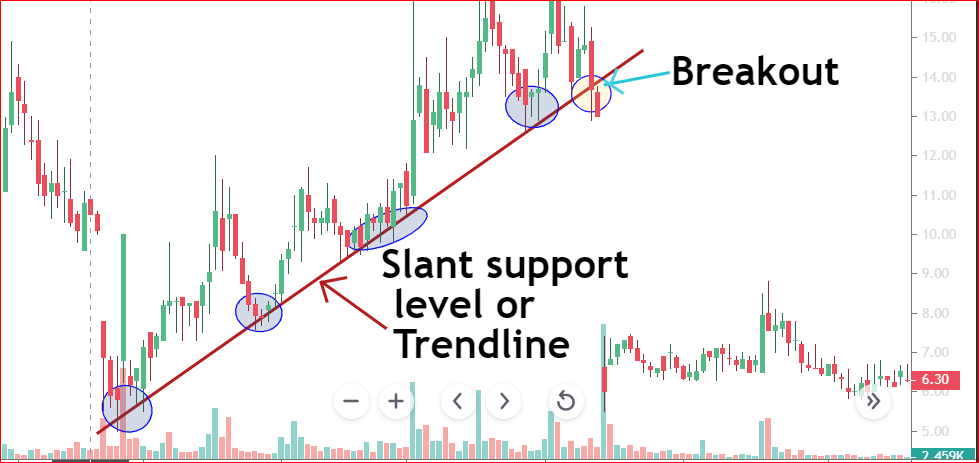
The price moved back up whenever it reached the support line or trendline. By using this technique you take a position whenever the price rejected the support on a heavy volume.
If you look at the volume levels at the bottom, the volume was relatively low whenever the price was consolidating at the support levels.
You can also see that the volume increased every time the stock rejected the support level. With this information together with other trading indicators and trading patterns, you can successfully use this support level to your advantage.
Final Words
Support levels are very important when you are trading. They help you predict possible trend reversal locations. By know where the support will be, you will know how to trade a stock or other securities you are trading.
You can also use support levels to exit your trade. For example, when you are shorting, you can use the support level as your exit levels.
It is very important to learn and master support levels as they come in handy when trading.
Support alone will not be enough for you to make a definitive decision on trading a stock. You must use other supporting indicators and patterns such as volume. This will help you make a better and rewarding decision.
As always, trading and investing activities come with risks. Protect your portfolio from major losses. Invest only what you can afford to lose.
Happy trading and investing !