What Is Resistance?
A resistance level is a price level where a stock or other asset prices cannot break above for a long time (minutes, day, weeks, etc). After a big rally in the price of the stock, the price reaches a level where it can no longer go up. Buyers lose momentum and the rally comes to a halt.
You can summarize the support level as a level where the supply increases which prevents the price from going much higher. In other words, the price becomes expensive to a level where buyers stop buying.
It is easy to understand if you use the supply and demand principals. When the product becomes cheap, more people buy it. Sellers will respond to the increasing demand by increasing the price. You can compare this increase in the price like the rally stocks get before hitting the resistance level.

However, there is a point where the prices of goods and services become too expensive to afford. At this point, buyers will stop buying and prices will drop.
This concept is the same for stocks and other tradable securities. After a huge rally in the price of the stock, buyers will realize that the stock has become expensive. Some of them will start taking profits in anticipation of a downturn. This move will increase the number of sellers of the stock and the rally will stop as a result.
The level where the stock price cannot break above for a while is a resistance level.
This is the opposite of support level which is a level where the prices of stocks and other tradable assets cannot break below for a while.
Table Of Contents
- What happens when the price reaches the resistance level?
- What can you learn from the resistance level?
- Basic resistance Level types
1. What happens when the price reaches the resistance level?
When the price reaches the resistance level, one of the following three things will take a place.
- The price will reverse the trend if there are enough sellers in the market
- There will be a consolidation in the price before the price reverses. Keep in mind that the price can reverse and follow its original trend after a pullback. The resistance level can be rejected many times before the stock price tanks.
- There will be a consolidation before the stock price continue the uptrend
Now let’s examine further in detail each one of these scenarios.
a. There will be a reversal after reaching the resistance level
Depending on the momentum of buyers and reasons the stock rallied, there could be a direct reversal in the trend without a consolidation. If there are a lot of people selling the stocks (those who are taking profit and others who shorting the stock, etc), the price will reverse immediately without consolidation.
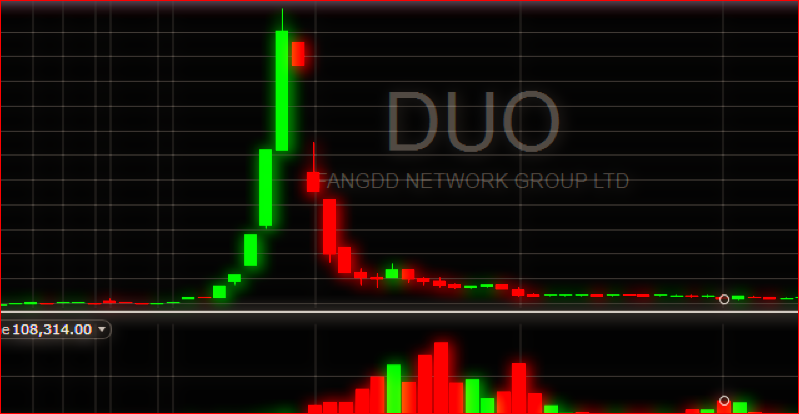
You can observe this scenario in Figure 1 depicted below.
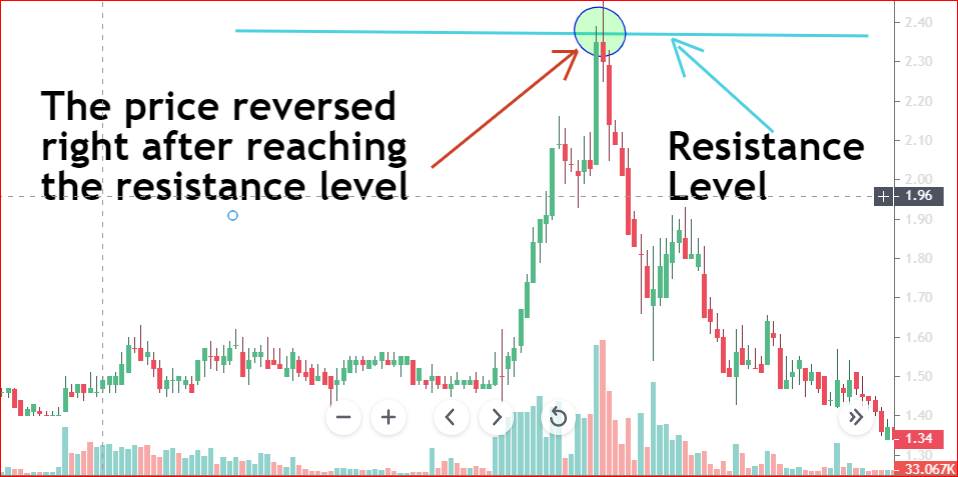
Figure 1. Shows a direct reversal in the trend after the price reached a resistance level
From Figure 1, you can see that after that huge rally, everyone wanted to get out of the stock. People who bought the stock at around $1.50 have made around 60% return in a few weeks. So, they wanted to sell their positions.
Also, after a huge rally like this one, people start shorting the stock which accelerates the selling pressure. The past performance of a stock can increase the selling pressure. For example, if a stock is not good at all, it will most likely go back down after a huge rally from sudden news.
By looking at the volume, you can see that the volume was really high compared to the previous trading sessions during the rally. Some of the reasons a stock can experience such an increase in the volume all of the sudden can be but not limited to the following.
Reasons for a sudden big rally
- The company beat earnings expectations
- FDA approved the company’s new drug
- The company is merging with another
- There is good news in the sector of the stock
- Competitors of the company gave up
- There is a hope for an economic recovery
You can also see that the selling volume was equally high. This is an indication that sellers are going to push the price much lower within a few days or weeks. It went up fast and it must come back down fast.
This is how it works in the market. Unless the stock is really good and has a lot of good supporting facts, it will come back down as fast as it went up.
You can tell what will happen by looking at the trading volume that follows the rally.
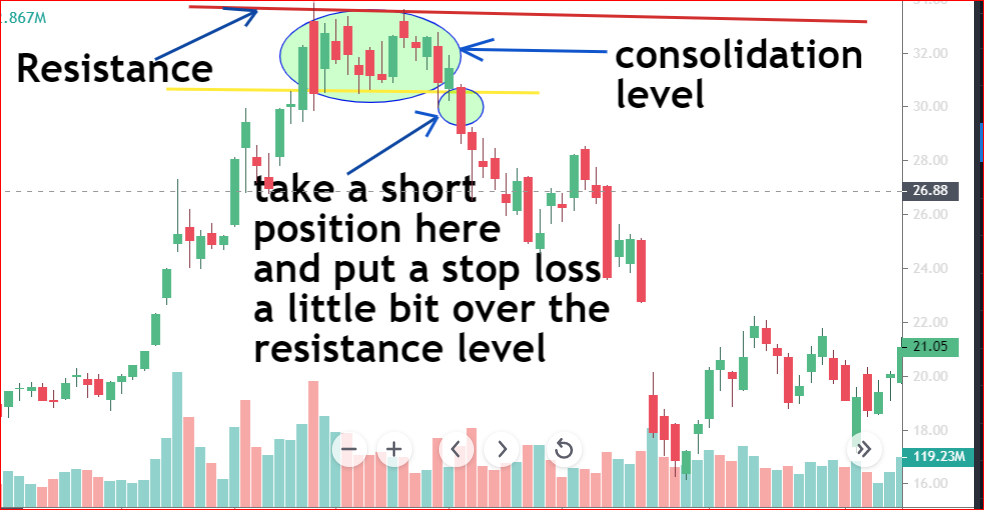
B. After reaching the resistance level, the price will consolidate before a reversal in the trend
There are times when the price will not drop right away after reaching the resistance level. The price will consolidate for a while before coming back down. The consolidation time can take days, weeks, months, etc. depending on the time frame you are using.
You can observe this scenario from Figure 2 depicted below.
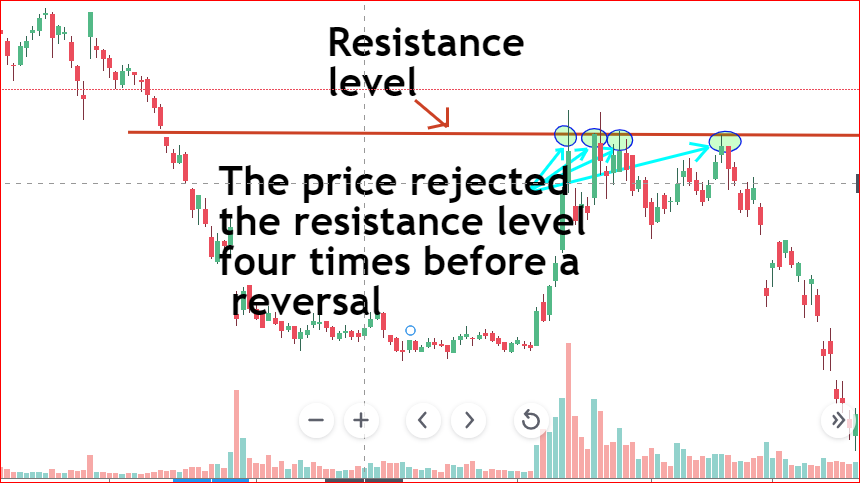
During the consolidation phase, there are not enough buyers to push the price much higher. At the same time, there are not enough sellers to bring the price down.
As a result, the price will consolidate around the resistance level until sellers dominate buyers or buyers dominate sellers.
After sellers dominate buyers, the price will reverse the trend.
Some of the reasons that can increase the selling pressure at the support level could be the following.
- Th company misses on earnings
- The stocks sector is not doing well
- There is a lot of uncertainty about the economy
- The company announced bankruptcy
- Sudden band news in the market
- A pandemic
- Shorting activities
- Privacy violations
How to trade a stock when the price reverses the trend?
Now we know that the price is indeed reversing. How can we trade the stock?
The figure below shows you how you can trade the stock if it reverses the trend.
If the stock reverses the trend, you will have to get out of a long position. This will apply only to those who practice day trading and swing trading.
Long term investors who stay in stocks for many years never worry about fluctuations in the price and do not use technical analysis to enter or exit trades.
You can short the stock if it reverses the trend. If the stock breaks below the lowest point possible of the consolidation phase on a high volume, it may be an indication of a downward trend.
You can then take a short position in the stock and put your stop-loss order above the resistance line.
There is a possibility that the stock can go back to the consolidation phase levels. However, if the stock breaks above the resistance level on a high trading volume, it may be an indication of a continuation in the trend. That is a continuation in the uptrend.
This is why you need to exit a short position as soon as the stock breaks above the resistance level.
c. The price will consolidate and then continue the uptrend
After buyers lose the momentum at the resistance level, the price will consolidate. During the consolidation phase, anything that can cheer up investors and traders will increase the number of buyers.
If the number of buyers increases at a high trading volume, the price will break above the resistance level and continue the upward momentum.
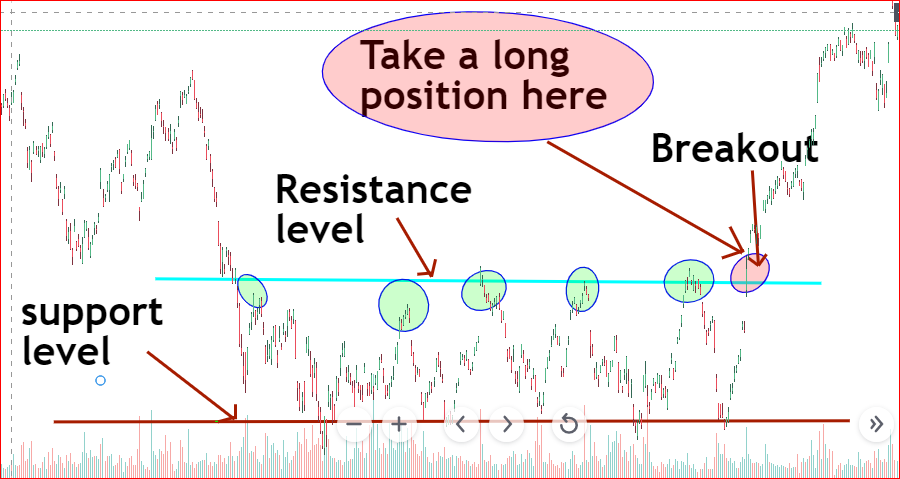
How to trade a stock if the price breaks above the resistance level?
You will need to take a long position right after the price breaks above the resistance level on high trading volume.
Many traders are always watching these levels. Whenever the price breaks above the resistance, they jump in and heavily buy the stock. This is why there is always a high trading volume after the breakout.
Please, refer to Figure 4 depicted below on how to trade the stock when the price breaks above the resistance level.
Your stop loss will be at the lowest point the price reached during the consolidation phase. In our example, your stop loss will be at the support level.
Keep in mind that not everyone is willing to lose over $3 dollars per share. Yeah, the real-life difference between the support and resistance lines in our example is over $3.
For this reason, you are the one to decide how much you are willing to lose per share to make this trade.
Here it is a better example shown on Figure 5 below.
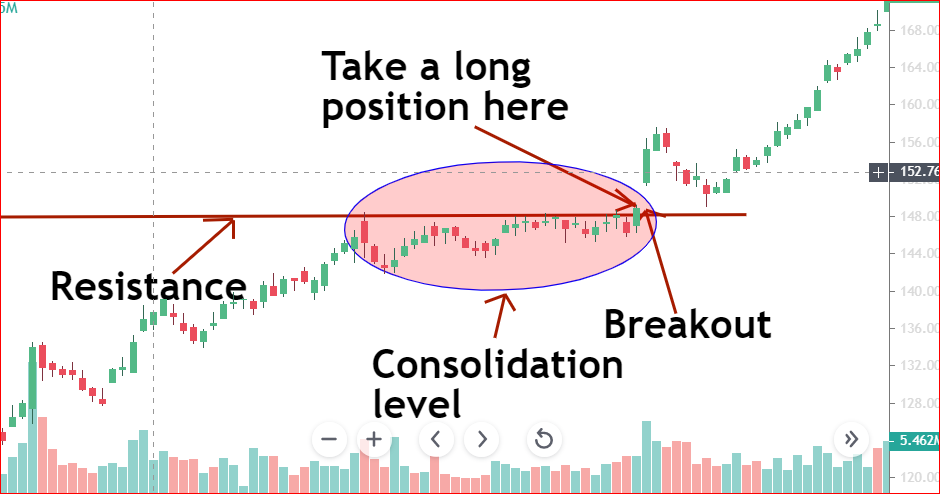
You can also use a tight stop loss and put it a little below the resistance level. There is a possibility that the breakout could turn into a false breakout. This will bring the price back into the consolidation area. So, you will be kicked out whenever the price breaks below the resistance level.
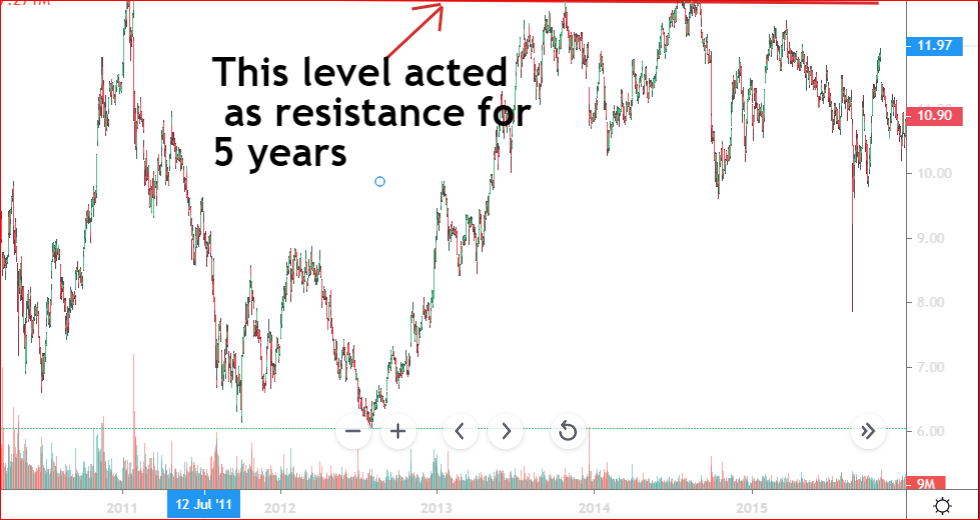
How long can a resistance level be used?
A resistance level is always valid as long as the company is still in business. That is, if a stock price had a major resistance at a level in the past, it will most likely have another resistance or support at the same level in the future.
For example, from the chart shown below in Figure 6, one level acted as a resistance for over 5 years.
2. What can you learn from the resistance levels
Now you know what resistance levels are and how to spot them. The next question is, what can you learn from them?
Resistance levels are widely used by all kinds of traders and investors to enter and exit trades. If a stock had a major resistance at a particular level, it is possible that the stock price will consolidate once it reaches that level.
This is true for other tradable securities as well. These levels happen very often as buyers start taking profits which increases the number of sellers. The price can either have a pullback or a reversal depending on how investors feel about the stock price and the company in general.
If you are trading, keep your eyes on these levels. You can sell all your shares or reduce your position size right at or before the resistance level. By doing so, you would have accomplished your one and only one goal in the market: LOCK IN PROFITs.
Should the stock price reverse the trend? You would have made a profit already. You can sell the remaining shares and exit your position.
What if the stock continues in the uptrend? You will still make money for a small position you have in the stock. Besides, you can wait for another entry point to form.
3. Basic resistance Level types
Resistance levels can have many forms. However, in this article, we will focus on the basic forms of resistance levels.
Horizontal resistance
Horizontal resistance levels are the ones that are established at a horizontal level. As the price moves up, there are levels where the buyer’s momentum will come to a halt.
This could be a profit-taking level before the stock continues the uptrend or where the stock price reverses the trend.
Another example of horizontal resistance is seen below in Figure 7.
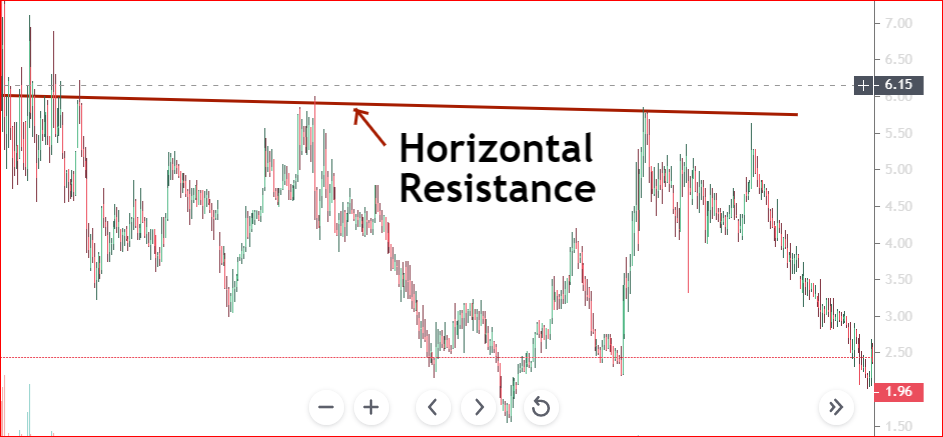
You can use technical analysis to help you determine the possible direction of the stock at the resistance level.
Slant resistance levels (Ascending or Descending)
Just like support levels, the resistance can be slant. These types of resistance levels will stop the price from going much high. However, they do it by following the price trend.
Refer to the following chart in Figures 8 and 9, for the visual aspect of slant resistance levels.
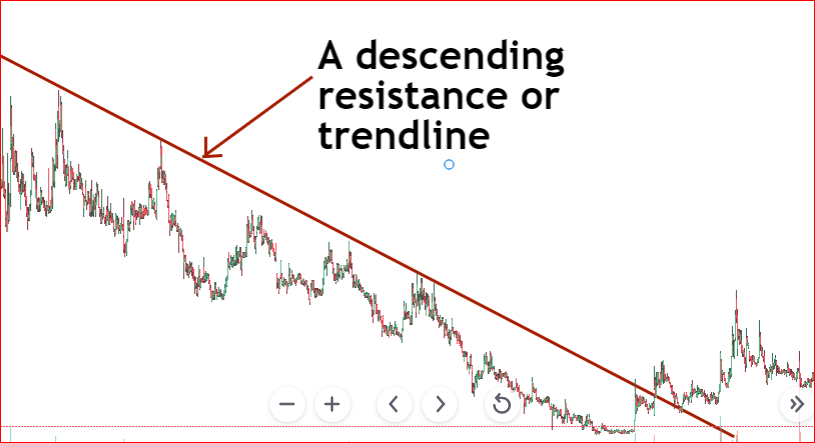
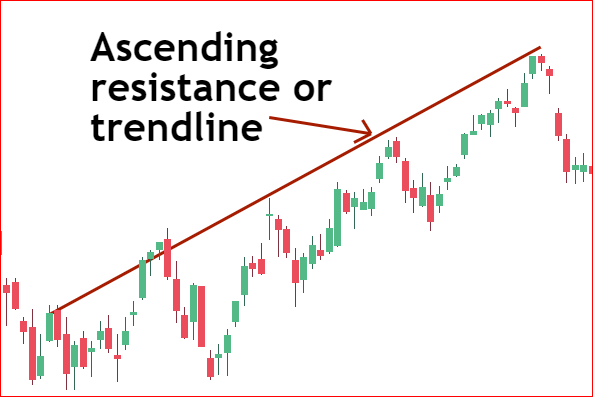
From Figures 8 and 9, you can see that the trendlines acted as resistance levels. Sellers took over whenever the price reached the trend line. You can use these levels together with other technical analysis techniques to enter and exit your trades.
Final Words
To become a successful trader, you must learn how to use support and resistance levels effectively. They are heavily used by short term traders and long term ones. It is important that you understand what the price will do when it reaches these levels.
This way, you will know what kind of trades to make and the ones to avoid.
They will also help you know whether you need to exit your entire position or downsize. Everything will depend on trading strategies you will be using and your risk tolerance level.
As always one strategy is not enough to help you make a final decision about a particular trade. By combining many strategies, you will reduce your chances of losing money on a trade.
Finally, all investment and trading activities have associated risks. For this reason, you must always use loss prevention techniques and invest only what you can afford to lose.
Happy trading and Investing !