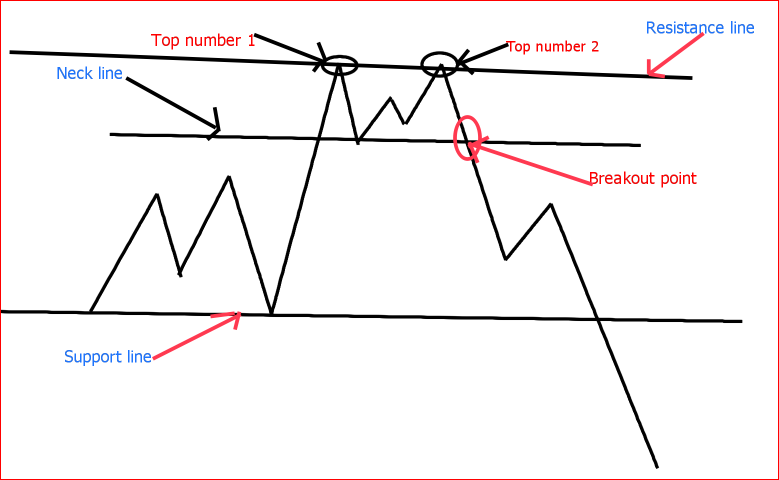
Double top pattern is a pattern used in technical analysis. This pattern is an indication of a bearish movement of a stock or a security. It is created when the price reaches the same top price twice without going any higher. There is always a brief reversal or profit taking between the first top and the second top. The bottom of the reversal is considered as a neckline and it forms a support level. In this article, we will examine in detail the double top pattern, how to notice it, and how to trade it.
Table of Contents
- Double top pattern
- Reaching the resistance level, the first time
- Reaching the resistance level, the second time
- Trading a double top pattern
- Bottom line
1. Double top pattern
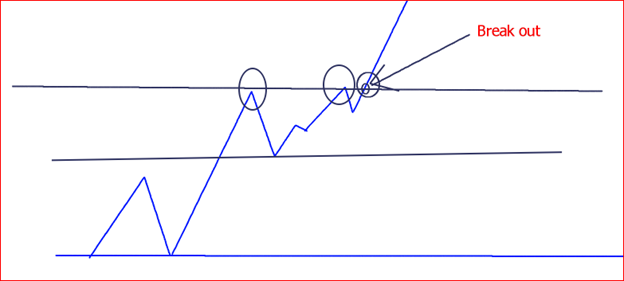
We know that it is a double top pattern once there is a breakout on the support level formed between both double tops as shown in figure 1 above. Without the breakout, it would be difficult to notice the double top pattern.
2. Reaching the resistance level, the first time
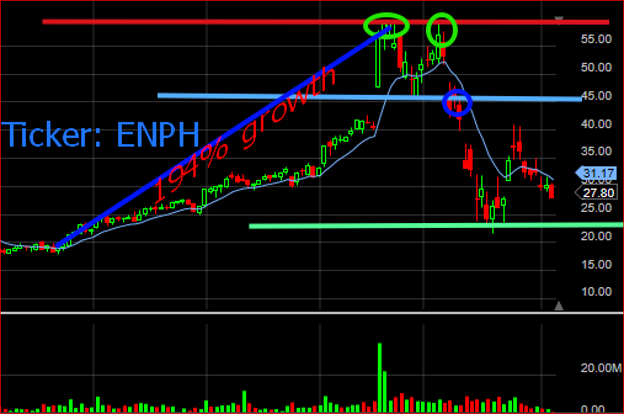
From figure 2, we can see that the stock started an uptrend from around $19/share. The rally continued all the way to $58/share. This was a buyer’s dominated rally. From our staring price of $19 to the stopping price of $58, the stock grew over 194%. This is a huge return for people who entered the stock when it was at $19 and those who bought it during the rally.
As we know it, whatever goes up always comes down. Even if you have a ton of people buying the stock, there will come a time when they take profit. That is what happened at $58 mark. Keep in mind that people took profit even before the stock reached $58. Levels of taking profits can be seen at $23, $27, $33, and $42. How do you know this? Profit taking is always indicated by a brief reversal in the trend which is followed by a continuation in the current trend after sellers are gone. This event creates what is known as a pull back.
Pullback
A pullback can be defined as a mall pause or a reversal in the current trend after a rally in the stock price. The pullback can be caused by profit taking or disturbance in the market or on the stock itself that causes more people to sell. Some traders define pullbacks as retracements.
When the price reached $58, many people realized that they have made enough profit on the stock. As a result, they started taking profits. At this point, the number of sellers increased and dominated buyers. This created a pullback and the price slid to $45/share. From $58 to $45/share mark a decrease of 22%. The stock became cheap, after this decline; and buyers started buying it again. Buyers dominated sellers and the rally continued again all the way to $58/share.
Neckline
After the price reached $45/share, buyers realized the stock was cheap and it was a time to buy the stock. More buyers took positions and dominated sellers. This event created a resistance at $45/share. Our price could no longer go any lower because of buyers. This resistance line is also known as a neckline. Some traders take positions at the neckline level hoping to get out at the second top or before for a quick profit.
3. Reaching the resistance level, the second time
The two tops are market by green circles as shown in figure 2. Once the stock reached the second top, more buyers were anxious. From technical analysis standpoint, $58 level formed a resistance on the first top. Resistance means that a stock price is not able to go higher than this level or was not able to do it in the past.
Whenever a stock reaches this level, traders are always watching. If the stock did not break this level before, what are the chances that it will break it now? This is an important question many traders ask themselves. The answer is, unless there is a catalyst in the market, the stock has some good news, or it is a real good stock; it will not break this level especially if the stock had a huge rally.
This is the reason many traders lock in profits before the second top is formed or at the second top. Traders sell a chunk of their shares and leave a few or get out completely. This event increases the number of sellers, hence, a reversal in the trend.
In our case, who was selling ENPH stock at the second top level? The answer:
- Traders who took positions at the neckline levels knew that $58 level was a resistance level. Therefore, they decided to get out with a 25% profit. Of course, those who bought above $45/share did not make 25% return on their investment.
- The other group is made of traders who were in the stock during that huge rally before the first top and did not sell during the pullback. They knew for sure $58 was a resistance level. So, they waited and sold at the second top level and locked in profits in case the stock plunges again.
- Finally, people who short stocks knew that $58 was a big resistance level after a big rally. They started shorting the stock heavily at the resistance level.
What do you think would happen after all these guys jumped in selling the stock? Sellers dominated buyers and we had a huge sell off on high volume. That is how we had our reversal in the trend. In addition, we can say that external factors contributed to the selloff. The Coronavirus created a panic in the market and people got out of their positions.
4. Trading a double top pattern
Now you have the basic understanding of a double top pattern. The question is, how do you trade a double top pattern? In the next few sections, we will provide ways you can trade double top pattern. Keep in mind that these are not the only ways to trade double top patterns.
Going long
Traders go long when they think that the stock will go higher. So, they buy a stock now hopping to sell it later at a higher price and cash in the difference. Break out above the resistance line is an indication of an uptrend or a continuation in the uptrend. Therefore, you would enter the trade when the stock price clearly breaks out above the resistance line.
Stock market is not predictable a 100%. You can take a position in a stock with all possible confirmations, and still the stock might go against you. For this reason, it is always a smart idea to use a stop loss for every position you take. After the breakout, the stock usually continues in the uptrend, unless something happens in the market or to a stock itself.
In this case, we would put a stop loss at the resistance level or below depending on how much we are willing to lose on our trade. Once the stock comes back and breaks back through the resistance level, it will most likely go down all the way to the neckline. It might be a lot of money to lose if you put your stop loss at the neckline. Also, you have no knowledge of where the stock will go once it reaches the neckline. That is why you need to put your stop loss close the resistance level.
Taking profit
To maximize your profit , you could take a position in the stock when the price rejected the neckline (support line). This is risky since you don’t know if the pullback will turn into a reversal in the trend. In this case, you would put your stop loss at the breaking point of the neckline or a little under to make sure that your stop loss is not too tight. This could be for a shorter term where you exit your trade at the resistance level or longer term where you stay in even after it breaks out above the resistance line.
You would take profit once the price reaches the next resistance level. You don’t need to get out completely. However, you need to sell some of your shares to lock in profit. If the price goes much higher, you still have shares left for more profit. On the other hand, if the price reverses at the next resistance, you would have made some profit on your trade.
Shorting
You can decide to short a stock, when you think that it has higher chance of a downtrend. Shorting means that you sell a stock when its price is high and buy it later once the price declines. In this case, you cash in the difference as your profit.
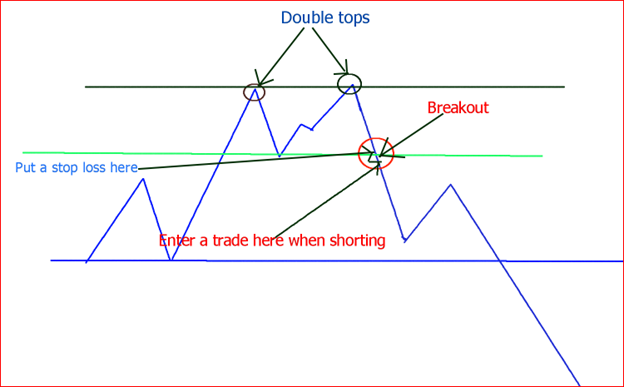
Once stock reaches the second top, you will need to wait to see whether the stock will continue its uptrend or reverse. Once it reverses, you need a confirmation that it is indeed a downtrend. The confirmation is formed once the price falls under the neckline or support level formed between the two tops. You enter your trade right after the support line is broken.
A stop loss is also needed to protect yourself against an upward trend. Your stop loss can be either on the neckline or close to it. In case, it was a false breakout, the stop loss will protect you from a major loss.
You will need to get out of your position once the stock price reaches the next support level on the downside. This is because your stock might form a double bottom pattern which is an indication of an upward trend or reverses once it hits the support level. Therefore, you need to either get out completely or buy most of your shares to lock in profit. You can keep your position if you are in for the long haul. In this case, you need a clear understanding of the stock movement and constantly monitor your position in case a major reversal happened.
Some traders take shorting positions at the second top. In this case, they a stop loss above the resistance line to protect themselves against an uptrend.
5. Bottom line
Double top is a wonderful pattern that signals a possible downtrend. However, if you decide to use this pattern, you must be careful of false price movements of the stock. A complete understanding of the pattern and how to play it is crucial to your success.
It is important to use stop losses for every trade you make to protect you from a downside when going long and upside when shorting.
As always, the material you learn from this website are not official investment guides. We are not certified investment advisers, certified financial assistants, or coaches. Therefore, we are not liable for investment decisions of any kind you make. For this reason, you must work with your investment coach, adviser, or certified financial assistant before making your stock trading and investment decisions.
Finally, invest the money you can afford to lose.