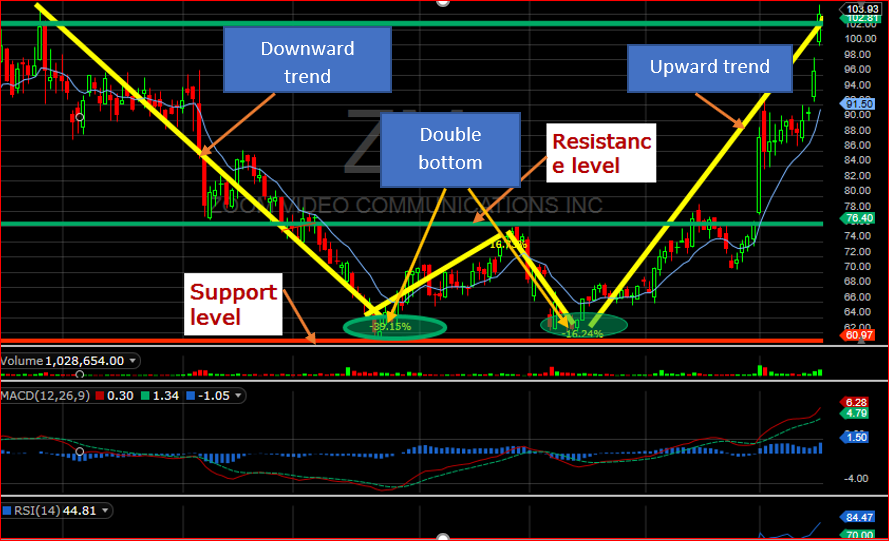
Double bottom is a very excellent trading pattern. This trading pattern happens when a stock price drops and hits a bottom level 2 times without breaking through it. Keep in mind that the bouncing price does not necessarily mean the same price value. For the triple bottom, the price touches and rejects the same bottom level 3 times instead of twice. Trading principle for double bottom and triple bottoms are the same. In this article, we will explore the double bottom.
The level on the chart where a security or a stock reverses the trend is called support level. The price gets pushed into a downward trend until it can no longer go down. As a result, it bounces when it hits that level. Usually these levels are anticipated in technical analysis by traders. They tend to work because at these levels you get more buyers than sellers which creates a reversal in the trend.
In this article you will learn what double bottom levels are, how to analyze a stock price movement on these levels, and how to use a double bottom to enter and exit a trade. We will provide basic descriptions of technical terms throughout the article before we use them. Therefore, Don’t be discouraged if you see some definitions as you navigate through the article. We used basic definitions when defining our technical terms to help people who are getting started with stock market.
You can click on the links below to read a particular section of the post.
Table of Contents
- Double bottom pattern
- Downtrend and reaching the support level the first time
- Reaching the support level, the second time
- Going long
- Going short/short selling or shorting
- How to trade a double bottom pattern?
- Bottom line
1. Double bottom pattern
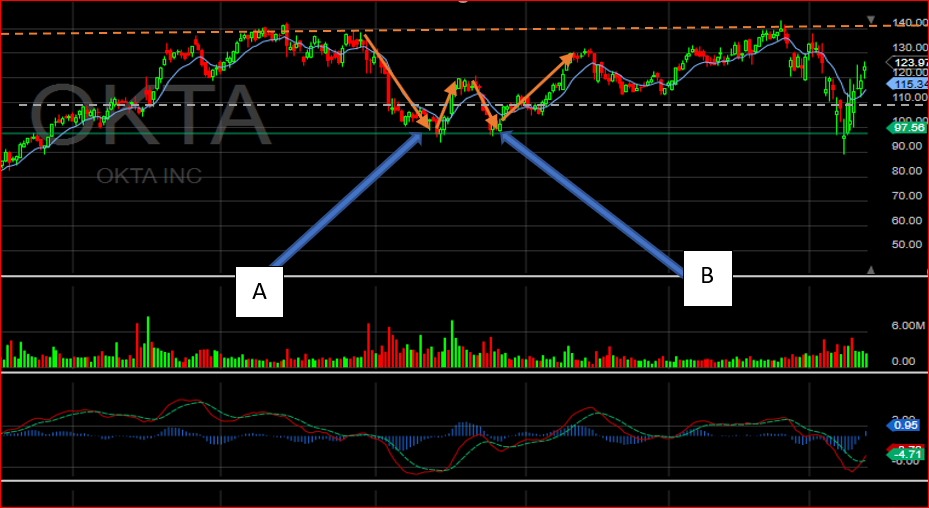
In this graph, we can see that the price dropped from $140 to around $97. When it reached this value, it reversed and went back up all the way to $120. The price dropped again back to $97. it did not go below $97, instead, it went back up. This movement created what is called a double bottom pattern. The price touched the same level twice without going lower. You can observe this situation in Figure 1. The graph made a shape of W. The lower corners of the letter W market our 2 levels touched by graph. The level at which the price bounced is called a support level.
2. Downtrend and reaching the support level the first time
The reason the price dropped from $140 to $97 is due to a simple business concept. Supply and Demand. When you have more sellers than buyers, you get more competition among sellers and the price gets pushed down as a result. Sellers are willing to reduce the price to get their products sold. On the other hand, when you have more buyers than sellers, the competition exists among buyers, and thus the price increases. Buyers are willing to pay more money on the product. This concept applies in stock market as well.
The price action from $140 to $ 97 mark what is known as a downward trend. In simple term, we have a downward trend when the price of a stock or any other security moves lower and lower over time. It is important to note that the price does not go down in a straight line. Instead, prices do fluctuate over time whether the trend is up or down.
Support level
We notice that the price had a change in direction around $97. Instead of moving much lower in the same direction, the price started increasing. The level where the price was not able to push much lower is considered a support level. This support area was formed because more people started buying shares of OKTA which pushed the price in upward trend.
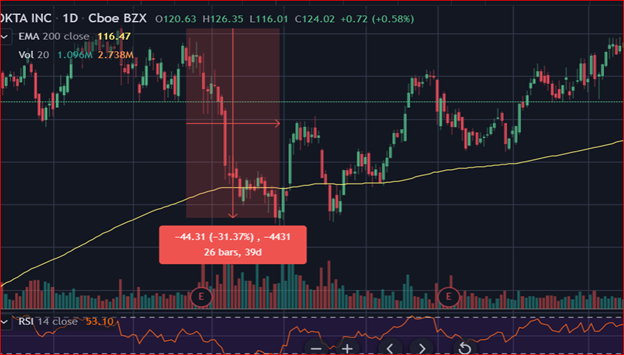
Buyers realized that the stock declined about 31% (check the highlighted area in figure 2). This simply means that OKTA is being sold at 31% discount. As a result, more buyers bought the stock. As we seen, more buyers mean competition among buyers which moves the price higher. This is what happened at this level. This was our first bottom and it is indicated by Box A in Figure 1.
The price moved back up to around $120. Why did it keep moving up? The answer to this question is emotions. That is right, the price movement in the market is caused by one thing: emotion. There are forks who thought they were being left out. Others realized that its price created a support at $97 and rejected that level and, therefore, it was heading up. Others wanted to buy more shares to average down and reduce their losses, others had no idea what they were doing.
Whatever reasons, all these forks were being driven by emotions. But wait, if people had a lot of emotions and wanted to buy the stock; why didn’t it keep going up after it hit $120 level?[answer: more sellers than buyers. Why? Keep reading. It is not this simple].
Consolidation level
Consolidation simply means that the stock or a security is not moving up or down on a large price trend. This means that buyers push the price up and sellers push it back down before it picks an upward trend. Then, buyers push it back up before it picks up a downward trend. This process continues until buyers overwhelm sellers and the price continues in upward trend. Or sellers overwhelm buyers which pushes the price into a downward trend.
In our case, sellers overwhelmed buyers and we got a downward trend. Why did sellers overwhelmed buyers?
Locking in profit
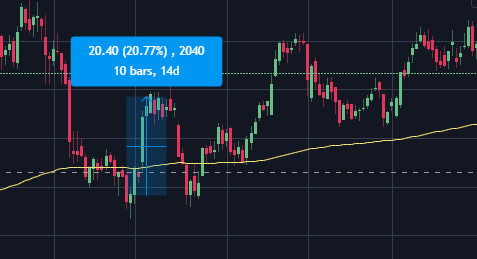
Let me ask you a question. What would you do if you bought the stock at $97 and the stock was consolidating at $120? When you log into your trading (brokerage) account, you can see how much money you lost or made on trade(s). Let’s assume that you bought the stock at $98. You realized that the stock is not moving up or down at $120. You check your account and see that you made over 20% profit (check the highlighted blue area on Figure 3). Without knowing where the stock is heading, you decided to sell and got out (this is called locking in profit).
Resistance level
Resistance level is a level at which a stock price is not able to push through after a big rally. At this level many traders sell their stocks before the reversal in the trend. You can see that at $140, $130 and $120 levels of figure 1, the stock was not able to push much higher and therefore many traders sold and got out of their positions.
More people took profit after a 20% rally in our example around $120 which is our resistance level. There could be more reasons why the trend reversed. For example, if the company had bad news more people could decide to sell before it was too late, or maybe bad news in the economy like trade war between US and China, etc. The reason does not matter. What we know is that sellers overwhelmed buyers at around $120 and the price took a downward trend again. We slid until we reached our $97 level. This was our second bottom and it is indicated by box B in Figure 1.
3. Reaching the support level, the second time
A lot of traders are always watching a stock when it is about to reach the support level the second time. The decision they make depends on the price movement after the second bottom. Three things will happen. The stock price will:
- Reject the support level and move in upward trend
- Breakout through the support level and continue its downward trend
- Consolidate and then proceed with trend reversal (case 1) or break the support and continue in downward trend (case 2)
The graphs below represent each scenario described above.
For case 1, we will use our figure 1. You can clearly see that our price bounced after hitting the support level at around $97 (please, see figure 1 in this article). The next figure, Figure 4, shows a price that consolidates at the support level before reversing back in upward direction.
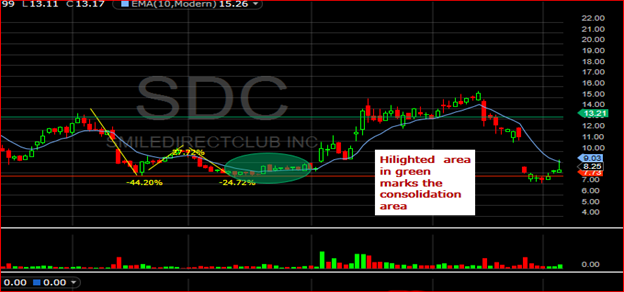
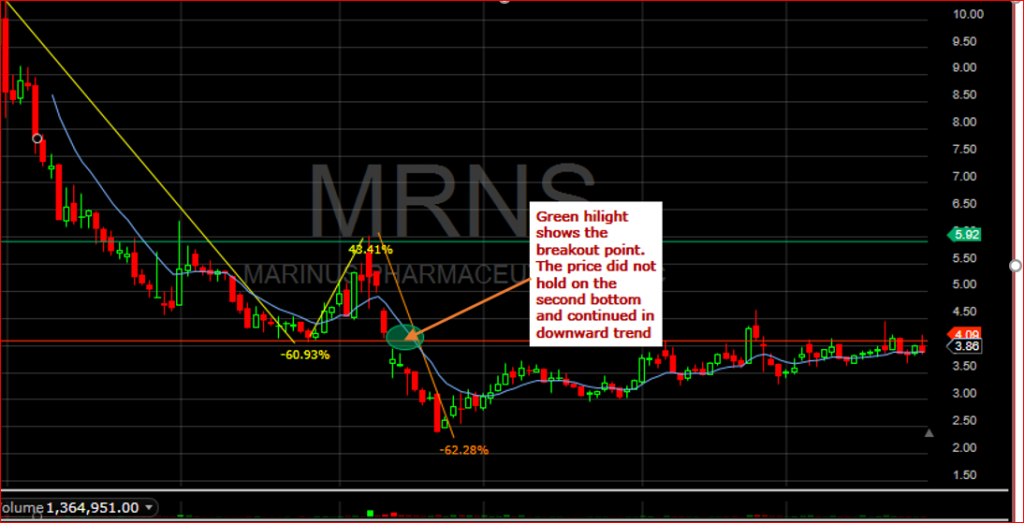
Figure 5 below shows, a stock price that hits the support level, breaks out and continued its downward trend.
Bullish/bearish market
A bullish market simply means that prices of stocks or securities are rising or expected to rise over time. That is, the expected trend for that market is an upward trend. When a stock has an upward trend or expected to have an upward trend, we say that it is bullish.
A bearish market is the opposite of a bullish market. Prices are decreasing or are expected to decrease over time. In the case of a stock, when prices are decreasing, we say that the stock is bearish.
The failed double bottom highlighted in Figure 5 indicates a bearish movement.
The reason we described all these scenarios is to help us understand possibilities of price movement and what to do base on each price movement. There are two ways you can trade a stock. Before proceed with trading a double bottom pattern, we need to know possible ways we can trade a stock.
4. Going Long
Going long, in simple terms means that you are buying a stock or a security now and you are hopping that its price will increase for shorter or longer term. Your goal is to sell it later at a higher price and cash in the difference. For example, there is an xyz stock that is trading at $2/share and you think the company is doing good financially. You decide to buy this stock at $2/share hoping that you will sell it later at $4/share. If this happens, you will cash in a profit of $2/share or a 100% return. In this case, we say that you are going long.
5. Going Short or Short Selling or Shorting
This is the opposite of going long. Shorting simply means that you sell x number of shares of a company now and hope that the price will go down over time. Your goal is to sell when the price is still up and buy the same number of shares after its price declines. Let’s use our xyz stock which is trading at $2/share. You think that the company is doing bad or the sector is going down. You decide to sell x number of shares at $2/share. After a while (could be the same day, months, etc.), the price declines and you buy the same number of shares at $1/share. Since, you sold these shares at $2 and you bought them back at $1; you made a profit of $1 per share or 100% return.
Stockbroker
According to Investopedia, a stockbroker is a professional who executes buy and sell orders of stocks and other securities on behalf of clients. In the past, people who wanted to trade had to call their stockbrokers and tell them how many shares of a company they wanted to buy or sell. Nowadays, technology has made everything easy. You don’t need to make calls at all.
You just need to create an online trading account (brokerage account) with an investment firm like fidelity investment, Robinhood, TD Ameritrade, etc. From there, you can buy and sell securities in mater of seconds without making calls. These investment firms have replaced our buddies we used to call.
The main question is: How do you sell shares (short sell shares) you have not bought yet? Well in stock market, it is important to understand that you can make money when the stock goes up or down.
When shorting, you borrow shares of stocks from your stockbroker. How does this work? Well, for each stockbroker, there are a lot of people or investment firms that own shares for the long haul. For example, a wealth person somewhere owns 1,000,000 shares of Apple and he doesn’t touch them at all. They are just sitting there, and he does not mind what happens to them. Your stockbroker can borrow 800,000 shares of Apple from this wealthy guy. Once your broker has these shares, you can borrow and sell some of these shares. You now have shares to sell.
The key point here is that you must return all shares back to your broker at a specified time. If you sell those shares and the price goes up, you lose money since you buy them back at a higher price. On the other hand, if you sell them and the price goes does, you make money. This is because you sell them at a higher price and buy them at a lower price. Thus, pocket the different.
There is one condition to be able to short stocks. You must have a margin account.
6. How to trade a double bottom pattern
At this point we know what will happen to the stock price once it hits the support level. Knowing this information was very important whether you are shorting or going long.
Two ways to enter a trade on a double bottom pattern when going long
If you are going long, you need a confirmation that the stock movement will be in upward trend. In other words, you do not buy when the price hits your support level. You need a solid confirmation that the price is going back up. There are two ways you can proceed after you get your confirmation.
- In our example from figure 1, you would enter a trade when our second green candle breaks above the previous green candle (Around $104) on high volume. This is one way you could enter this trade.
- The other way to trade this pattern is to wait until the stock price breaks above the previous high. In our example of OKTA, our previous high is around $120. Once the price rejects the support area and moves in upward trend, you will need to wait and see what happens when it reaches the previous high level. If it breaks above the previous high, it is a possible indication of continuation in the upward trend. In our example, the price broke above the previous high of $120. Many short term and long-term traders enter the trade as soon as the previous high level is broken. You would buy right after it breaks above $120 since it is our short-term resistance level.
How to exit trades when going long on a double bottom pattern?
You can exit a trade in two ways. The first one is getting kicked out the market by a stop loss order. The second is taking profit.
a. Stop loss order
In simple terms, a stop loss means that the trader makes order to sell a stock or a security in case it reaches a predetermined value. This helps the investors to minimize losses in case the trade goes against them. For example, you buy a stock at $2/share. You hope that the stock will go up in the future. Unfortunately, the stock goes down and reaches $1.00/share. You acted smart and put a stop loss at $1.90/share right after you bought it.
Explanation………
This means that if the stock goes down in direction you did not anticipate, your stop loss order becomes market order and shares you specified get sold at the best price possible. Your stocks could sell at $1.80/share instead of $1.90/share you specified. This is loss of 20 cents/share. However, it is a small loss compared to selling at $1.00/share. You can see that a stop loss can help you minimize your losses in case the market goes against you.
In our example, if you bought the stock right after it rejected the support level; it is recommended that you put your stop loss at the previous low. That is, your stop loss will be at the lowest level of your previous low (previous bottom in this case). If the price breaks below your level, you will be kicked out the trade.
If you entered the trade right after the stock broke above the previous high ($120 level), you would put your stop loss a little under $120 level (at the bottom of those consolidating candles in Figure 1). This is because your stock will probably have a downward trend once it breaks below this level again. You don’t want to hold them any longer because you have no assurance that it will bounce back up when it reaches the support level.
b. Taking profit
Regardless of where you entered the trade, you would be expected to take profit as soon as the price reaches the next resistance level. You don’t necessarily have to sell everything at this level. Instead of selling all your shares, you can sell a few and lock in profit. If the stock goes down, you would have made some money. On the other hand, if the price goes up more, you still have few shares left to make more money on.
How to enter a trade when shorting a double bottom pattern? What if you are shorting?
For those who are shorting, you need a confirmation of a downward trend once the price hits your support level the second time. This means that the stock will have to break the bottom of the previous low before you enter the trade. The support level will have to fail for you to enter the trade. A failed support level indicates a possible downward trend. The stock price will continue decreasing until it reaches another support level.
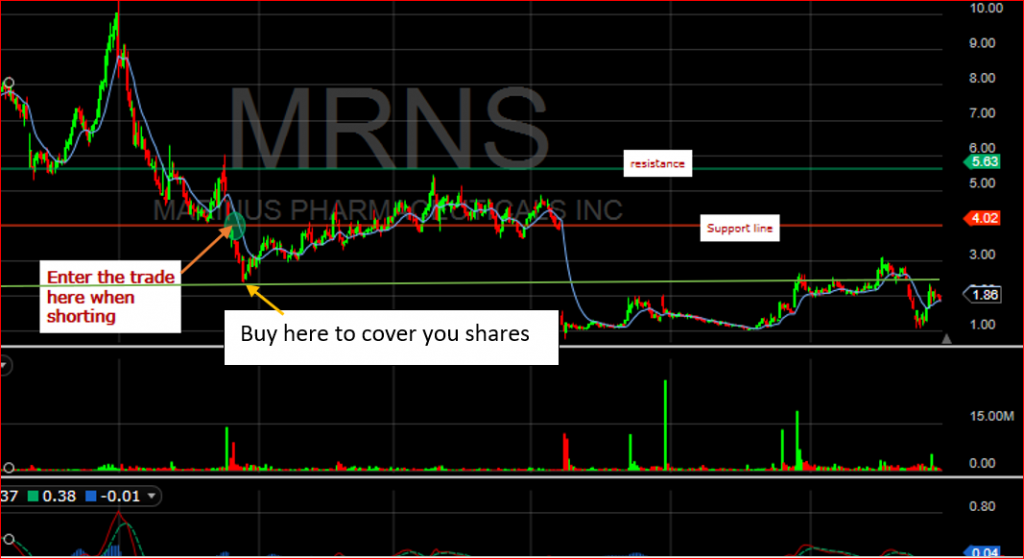
As a shorter, you would be expected to cover your positions before or when the price reaches its next support level. This is because at this level, it is possible that the price will go up. And you don’t want this to happen when shorting. Therefore, you need to buy all shorted shares or a few to lock in profit.
Where would you put your stop loss in case you are shorting?
For those who are shorting, you need to make sure that you get out when the stock shows a clear indication of an upward trend. Since we have seen that you would enter the trade when the price breaks below your support area, you would put your stop loss a little above that level. In other words, if the price breaks below and comes back above your support level with a upward trend, you will need to get out. Putting your stop loss, a little above your support level will kick you out of the market before losing a ton of money.
We are not Gods. It is true that we can sometimes lose on our trades. There are times we enter our golden trades and later realize that we were wrong. You need to place your stop loss order every time you make a trade. For simplicity, get out when there are signs of an upward momentum.
7. Bottom line
Double bottom pattern is one of the most used patterns. It is easy to recognize and understand. There is no single pattern that gives you the full picture of the market direction or price movement. It is recommended that you use a combination of multiple patters and indicators when trying to understand the stock you want to trade.
It is important to understand that the market will not always behave the way you anticipated. This is why you should never forget to use stop loss for every trade you make. Stop loss orders will protect you from bigger losses and give you a chance to trade again.
Our material do not serve as official guide to making trades. Theretofore, there is no guarantee that you will succeed 100% by only applying what you learn from here. We only help you understand how the market works and how to analyze specific events in the market and proper steps you can take if you decide to trade.
We recommend that you consult with a professional financial adviser, a mentor, or other certified financial planners to guide you in your trading journey.
ALWAYS TRADE WITH MONEY YOU CAN AFFORD TO LOSE!