What is average directional index?
The average directional index is a technical analysis indicator that helps investors and traders to determine the strength of the trends of stocks and other securities. Spotting trends is not an easy task due to price fluctuations that cause false trends.
False trends always lead to bad investment decisions. To avoid major losses and increase returns on investments, investors rely on technical analysis to analyze the price movements and increase their certainty about the trend direction.
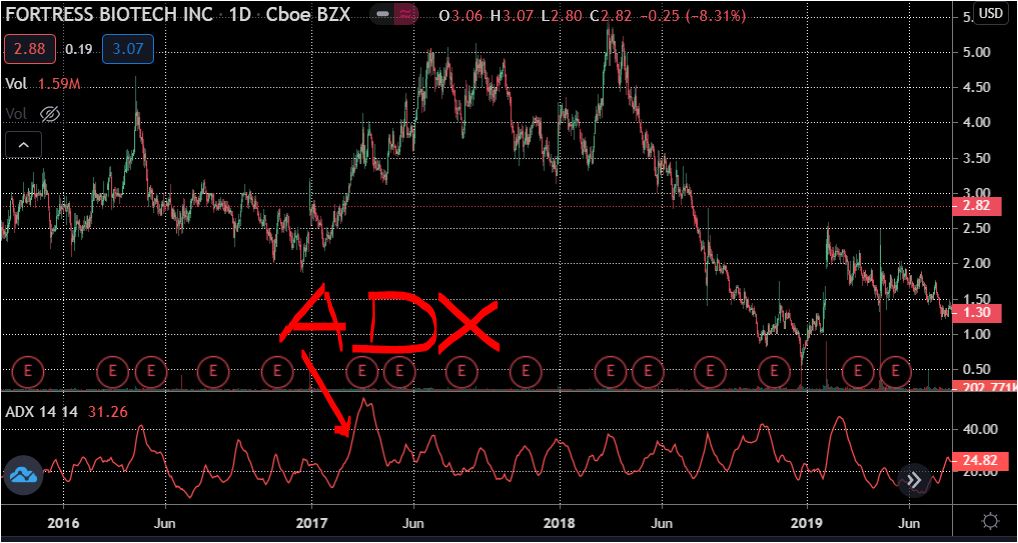
One of the most important trend analysis indicators is the average directional index or ADX in short. This indicator helps investors know when stocks and other securities are trending very strong.
Benefits of ADX?
The average directional index is calculated from multiple lines of indicators which are the positive average directional index(+ADX) and the negative average directional index (-ADX), according to StockCharts. The positive and negative directional indexes show the trend direction while the actual ADX shows the strength of the trend.
These indicators are momentum indicators and they help investors know who is in charge in the market.
When the +ADX is above the -ADX, it indicates a market dominated by more buyers. In other words, the bulls are in control of the market. Investors can then take long positions or exit their short positions.
On the other hand, when the +ADX is below the -ADX, it indicates that the bears are dominating the market. From this information, investors can then make trading decisions based on their strategies.
It is also important to mention that a cross between the +ADX and -ADX can be a buy or sell signal.