The Aroon is a technical analysis indicator founded in 1995 and it determines when stocks are trending and the strength of their trends, according to StockCharts.
This indicator has two different parts (Aroon-Up and Aroon-Down) that work simultaneously to measure how long it has been since the price reached a high or a low.
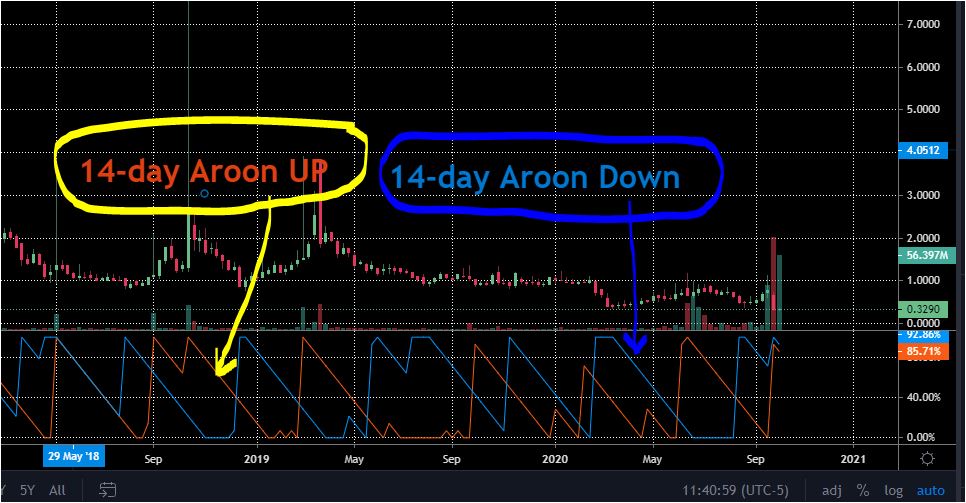
Example of aroon indicator
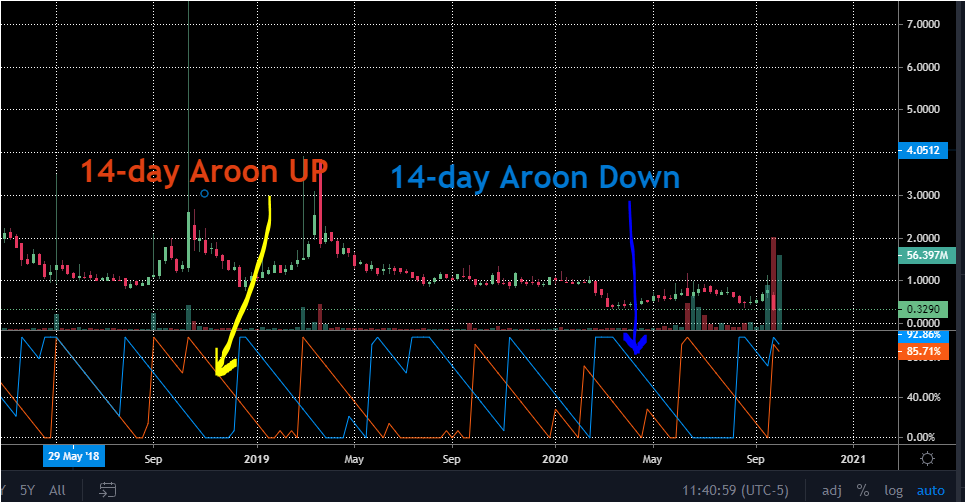
The chart above shows a 14-day Aroon. As you can see, the Aroon indicator has two parts.
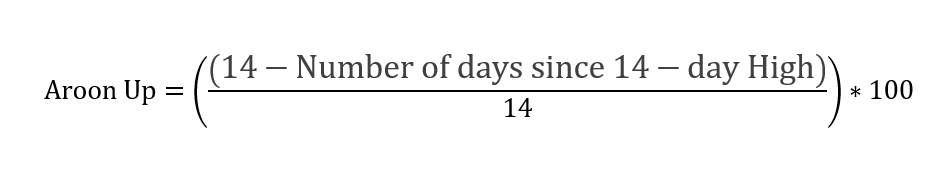
The first part is the 14-day Aroon-Up which measures the number of days since a 14-day high.
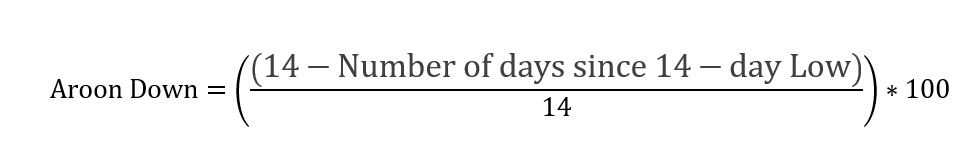
The second part is 14-day Aroon-Down which measures the number of days since the 14-day low.
The formula of aroon
The Aroon indicator is calculated periods. The following is the formula for the 14-day-Aroon indicator we used in the above chart.
When the time between the new high or low increases, the Aroon will decrease and vice-versa.
The number of periods used for this indicator is usually over 25.
How to use aroon indicator?
This indicator oscillates between 0 and 100 with 50 being the middle. This indicator can be used to show the market sentiments.
If the Aroon Down is above 50, and the Aroon Up is below 50; this will indicate a bearish sentiment about the market. As a result, the bears will most likely dominate the bulls during the next few days (depending on your time period).
On the other hand, the bulls will dominate the bears during the next few trading sessions if the Aroon Up is above 50 and the Aroon Down is under 50.