What is a moving average?
A moving average is a statistical method used to smooth price data by creating a series of averages from the main data set, according to Investopedia. As the price moves up and down, it becomes a little difficult to know the possible short term or long term trend of the asset price.
By creating a series of averages points that follow the main price data set, fluctuations will be removed. This will make it easy to understand the data and see the current trend of stocks and other assets.
Moving average is a lagging indicator since it uses past data to estimate the trend of the asset in questions. They are widely used in technical analysis by traders to help them understand the trend in prices of assets they are trying to trade.
How to calculate a moving average?
The simplest form of M.A can be calculated by adding prices over a time frame and then divide their sum with the total number of periods. This means that you will get one data point for every time frame you choose.
For example, let’s say that we want to calculate an M.A of a stock with a period of 5 days. The prices of the stock in the past five days were the following.
- First day: The price was $1.5 per share
- Second day: The price was $1.65 per share
- Third day: The price was $1.40 per share
- Fourth day: The price was $1.55 per share
- Fifth day: The price was $1.70 per share
Now that we know the stock prices of the past five days, we are going to add them and divide their sum by 5 to find the average price for these five days.
Moving Average = (1.5+1.65+1.40+1.65+1.70)/5 = $1.58
Example of M.A on a chart
This means that for the last 5 days, the average price of the stock is $1.58 per share. As the price moves further, we will be averaging prices of 5 days and plot that point on a graph.
Over time, you will see a line graphed on a chart that lags behind the actual price on the chart. This line will be your moving average with a period of 5 days.
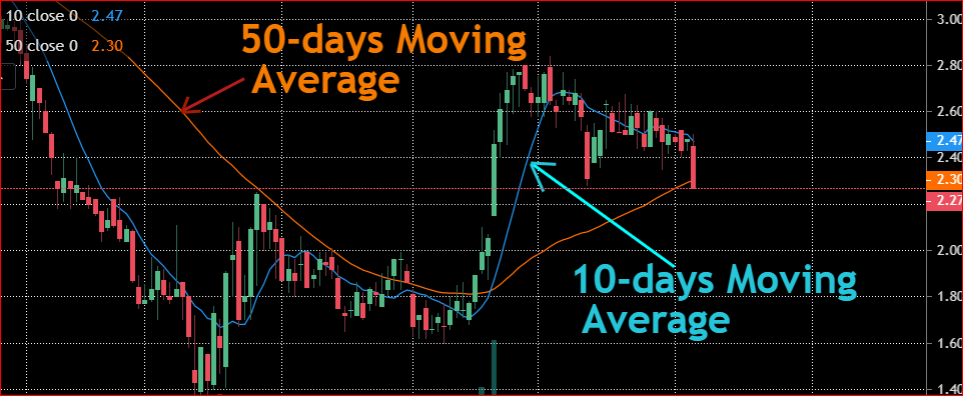
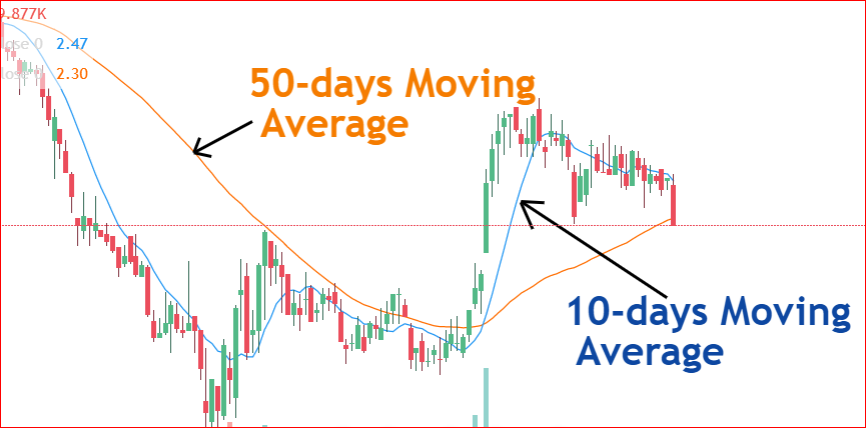
In our example shown in the chart above, we have plotted two different moving averages at the same time. The first is that 10-days moving average whereas the second is the 50-days moving average.
You can see that a small length or period creates a line that is closer to the actual data. This means that a smaller period or length creates averages that are closer to the main data points.
On the other hand, the average points will be different from the main data as you increase the length. This is why the 50-days moving average was plotted further from the main data points. In other words, we are averaging 50 prices to create one average. The outliers and noise in the data are get smoothed out when the period is higher.
Types of moving averages
There are three types of moving averages.
Benefits of moving averages
M.As reduce lags and fluctuations from the data which makes it easy to see the trend in prices of assets.
Also, they can help you see the short term and long term trends by using multiple time frames on the same chart. You can observe this scenario from the chart above where we plotted a long term M.A (50-days) and a short term M.A (10-days)
Final words
Moving averages can help you examine the market or asset trends. You can then use this information in your trading strategies.