What is trading volume?
The trading volume is the number of shares of a stock and other securities traded at a specific time frame. These securities can be stocks, bonds, contracts, options, currency, cryptocurrencies, etc.
Every time frame has its own volume. For example, you can have a volume for 1 minute, 5 minutes, 1 hour, 4 hours, week, 1 month, etc.
The trading chart will display the movement of a particular stock or commodity based on the time interval you chose.
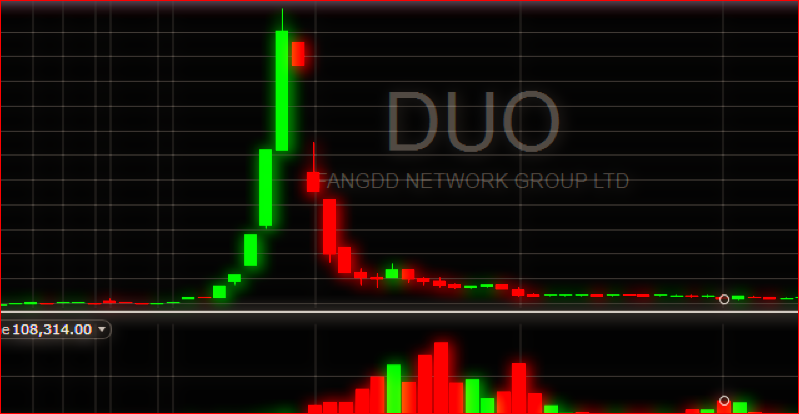
Example of volume on the chart
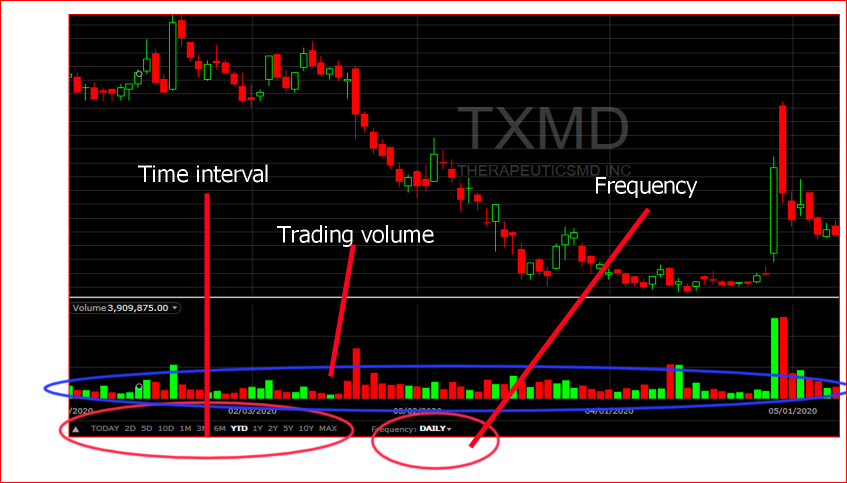
From Figure 1:
- Time interval: Represents the historical performance of a stock to be displayed on the chart. If you choose 5 years, for example, your chart will display trading activities that took place within 5 years.
- Frequency: Displays the time frame of trading information to be displayed on the chart. That is, your chart will display candlesticks and volume based on the frequency you selected. If you choose daily, you will see daily candlesticks and daily volume on your chart. If you choose weekly, your chart will display weekly candlesticks and weekly volume.
- Trading Volume: Trading volume displays how many shares traded at the specific frequency you selected.
It is important to not confuse time intervals and frequency. The time interval shows you how a stock performed during the time you selected.
On the other hand, the frequency shows you a deeper analysis of the same stock at a specific frequency you selected. It gives you a chance to decide whether you want hourly, daily, weekly, etc. data to be displayed.
Use the following examples of frequency for further clarification.
Daily means that the chart will display daily candlesticks and daily volume. This means that each candlestick will represent one trading day. In addition, one volume bar will represent the number of shares traded on the same day.
Weekly means that the chart will display weekly volume. That is, each volume bar represents the total number of shares traded each week and each candlestick represents weekly price movement.
What does volume mean when trading?
The volume is a great indicator many new and experienced traders use. It can help you decide when to take a position in a stock or exit.
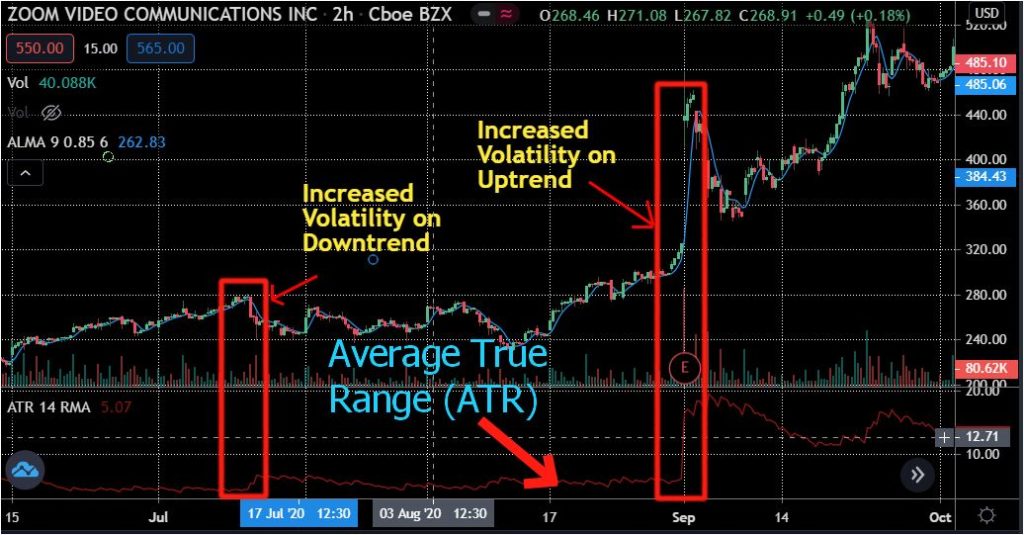
The volume is mainly used to reinforce your trading strategies. For example, if the volume increases on the buying side with high volatility, it could be a signal that the price is going to increase.
Other the other hand, if the volume increases on the selling side, it could indicate a bearish movement in the stock or stock.