What is a candlestick?
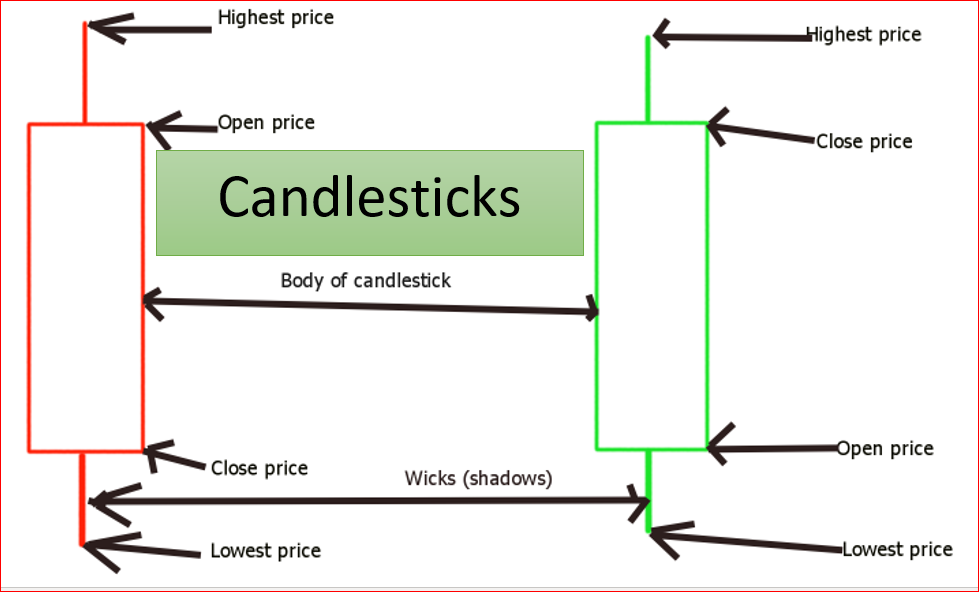
A candlestick is probably the simplest and easy to understand price chart. It shows the open, close, high, and low price levels of a stock or security during a trading period time. Any trading interval you choose will be represented by one candlestick.
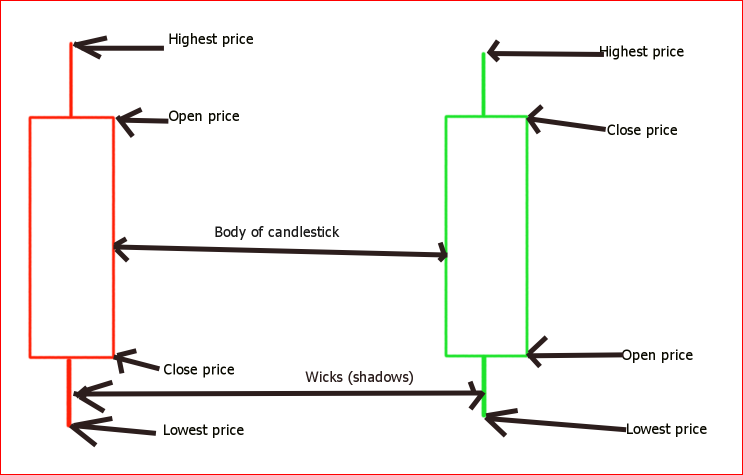
The body of a candlestick represents the area between the open and the close price of a stock or security. On the other side, wicks show the highest and lowest prices reached by a stock compared to the open and close prices.
Green candlesticks show that there is a strong buying in the market. For this reason, the closing price is higher than the opening price.
Red candlesticks show that there is high selling pressure in the market and therefore, their closing prices are always lower than their opening prices.
Role of a candlestick
Traders use candlesticks and their formations in technical analysis. Each candlestick is a visual representation of what is happening in the market behind the scene. It shows the investors’ sentiments toward a particular stock or security. Therefore, investors can make trading decisions based on this information.
Candlesticks have many forms and each represents different price action in the market.
If you want to be a successful trader, you must learn how to read candlesticks.


Thank for stopping by, Maudie. I appreciate your feedback and suggestions.