What is EMA?
Exponential Moving average (EMA) is a statistical metric used in technical analysis to find trends in prices of stocks and other assets. Traders and investors use EMA to smooth data by removing fluctuations or spikes in the prices which help them visualize the trend. EMA is related to other moving averages such as simple moving average (SMA) and weighted moving average(WMA).
You can interpret the EMA as an SMA. The only difference is that the SMA simply calculates the averages of prices in a given time; whereas the EMA applies more weight to current price data during its calculations, according to Fidelity Investments.
For this reason, the EMA will follow data more closely and will be prone to spikes in prices compared to the simple moving average.
How to calculate Exponential Moving Average?
You can calculate the EMA by using the following steps.
Step 1: Calculate SMA of the first price data as defined by your length. This SMA will become your initial EMA for your calculations. That is you will use the SMA as your previous period EMA.
Step 2: Calculate your weighting multiplier. Recent prices will get more weight in the calculation. The formula for weighting multiplier (k) = 2/(n+1), where n is your length or period. For example, a 20-day EMA has a period or n =20.
Step 3: Calculate the daily EMA between the current day. You will use the current price, the previous day EMA, and the weight multiplier in the following formula.
Exponential Moving Average (EMA) = [(C-P)*k]+P
Where:
C = Current Price
K = Exponential smoothing constant = 2/(n+1), where n is the number of periods
P = Previous day EMA
Example of EMA on a chart

The EMA will follow data closely compared to the SMA. This is due to the weight that is applied to the most recent data when calculating the EMA.
You can see this distinction between the EMA and SMA on this chart. The 20-day EMA is closer to the data than a 20-day SMA.
Example of the exponential moving average calculation
We are going to use an example of 20 data points with a period of 5. That is the length (n) = 5 and therefore, our weighting constant will be 2/(n+1) = 2/(5+1) =2/6= 0.33. This constant will be the same for all our calculations. Please, refer to the table below for our data and more calculations.
The initial EMA will be the SMA of first five price points. That is
EMA_initial = SMA = (1.5+1.55+1.48+1.5+1.57)/5 = 1.52
By applying the EMA formula from above, we were able to calculate EMA prices for each day. As new prices come in, old prices will be dropped.

Benefits of Exponential Moving Average
The exponential moving average reduces lags in the time data which in the end protects information from distortion.

EMAs also help traders to confirm trends in prices of securities they are trading.
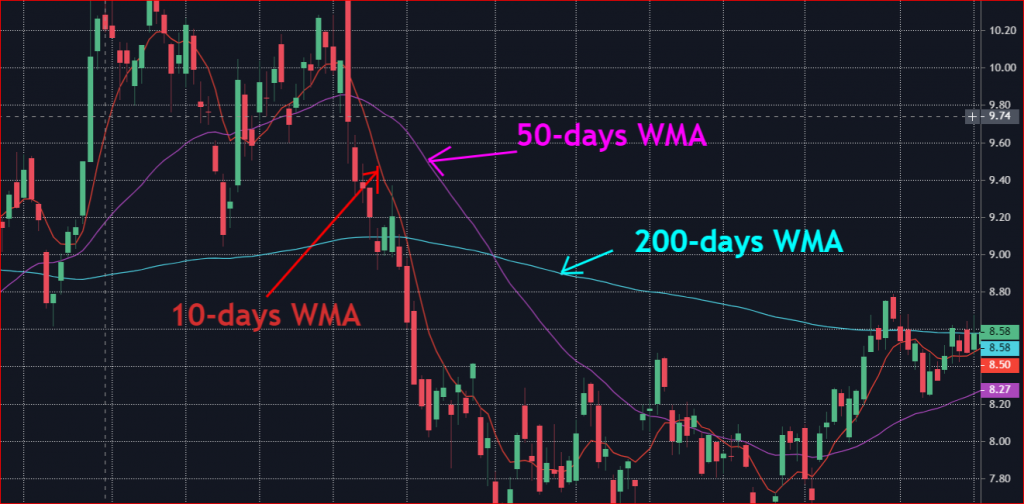
In addition, you can use a combination of multiple EMA on the same chart to help you spot a possible trend change.
That is if the short term EMA breaks above the long term EMA, it will indicate an uptrend. On the contrary, if the longer-term crosses above the shorter-term exponential moving average; it will indicate a downtrend.
You can visualize this information in Chart 2 above.
Final words
The exponential moving average is very important when it comes to clarifying trends. It can help you confirm the current trend of a stock you are trading. However, they are prone to sudden spikes in prices as they closely follow the market prices.
A combination of multiple EMAs on the same chart can help you in your trading strategies. It is also important to use other trading indicators and trading patterns to support your trading decisions.
Due to the high risks of losing your capital in the market, always invest based on your risk tolerance. More importantly, remember to use risk prevention methods such as stop-loss order, limit orders, trailing stop orders, etc.
Happy trading and investing !


