What is a Death Cross?
A death cross is a trading chart pattern that indicates that a stock or another tradable asset is about to experience a major selloff. This happens when a long term moving average crosses above a short term moving average. Traders who believe in this pattern think that the stock is dead once this phenomenon occurs, according to the corporate finance institute.
Understanding the Death Cross
We need to understand how a death cross is formed in order to give it a meaning.
We know that it happens when two moving averages cross each other. That is a long term moving average goes above a short term moving average.
Why do moving averages matter in the first place?
Well, moving averages help traders and investors about the trend of stocks they are trading. By the way, there are many types of moving averages.
You can learn in detail with examples about moving averages from the following links: simple moving average (SMA), weighted moving average (WMA), and exponential moving averages (EMA).
They all play an important role in smoothing data and confirming prices’ trends. They can also act as support levels and resistance levels depending on price movements.
Traders can learn a great deal by using a combination of multiple moving averages on the same chart. In this case, one will be a short term moving average whereas the other will be the long term.
The short-term moving average means that the period used is small. For example, a 20-day moving average means that 20 days’ consecutive prices are being used to create one point in the moving average series.
Furthermore, a long term moving average means that the period used in its calculations is long. For example, a 100-day moving average means that for every 100 days’ prices we are getting one point for the moving average.
I think you got the point.
More basics on moving averages…….
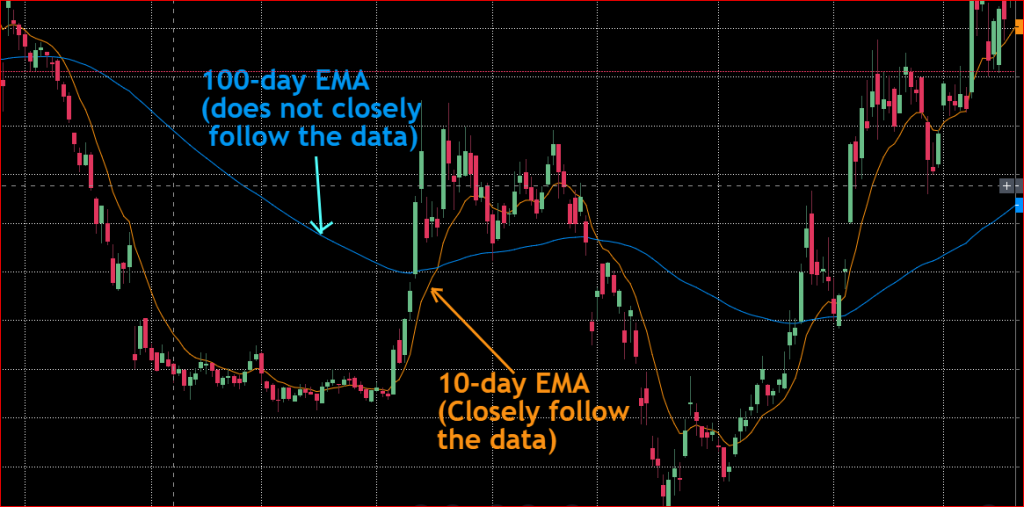
Note 1: A short term moving average will closely follow the data and therefore, it will be choppy. For this reason, it will be prone to random spikes in the stock prices.
Note 2: The long term moving average will not closely follow the actual prices. Instead, it will be drawn far from the data, and therefore, it will be smoother compared to the short term moving average. Long term MAs are not prone to spikes because big spikes or fluctuations are eliminated as you average more data.
You can view note 1 and note 2 in Chart 1 depicted above.
It is also important to know that on uptrends, the moving averages are drawn under the chart bar, and above on downtrends.
Back to the death cross
By now, you should know what each moving average means on a chart.
As prices move up and down, moving averages will follow them or lag behind them. There will be a time when these moving averages cross each other.
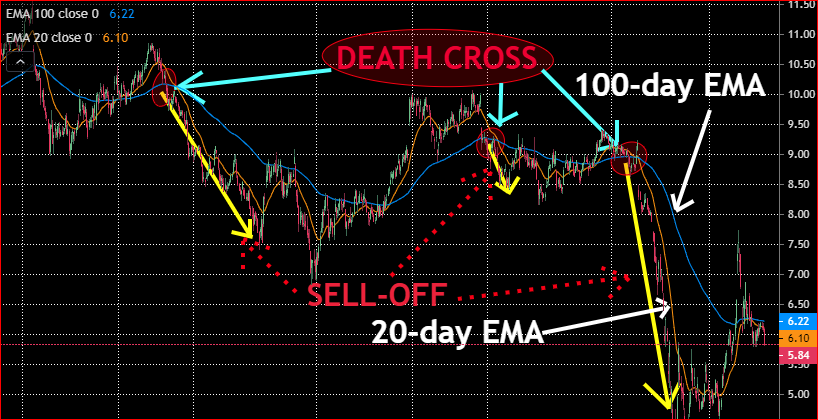
When two moving averages cross each other we call it a moving average crossover. When this phenomenon happens when a long term moving average crosses above a short term moving average, we call it a DEATH CROSS.
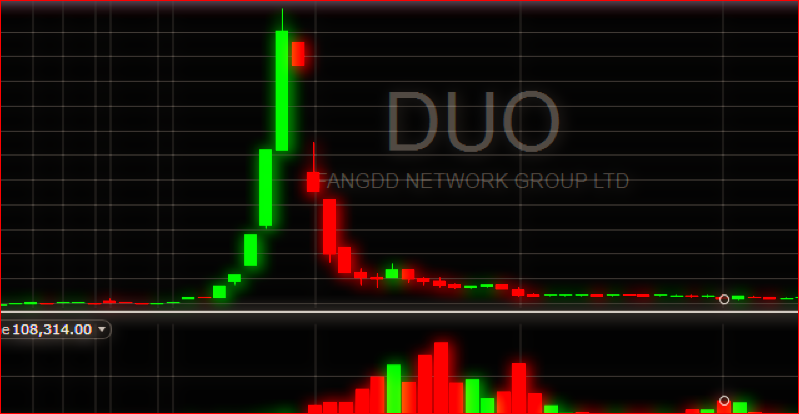
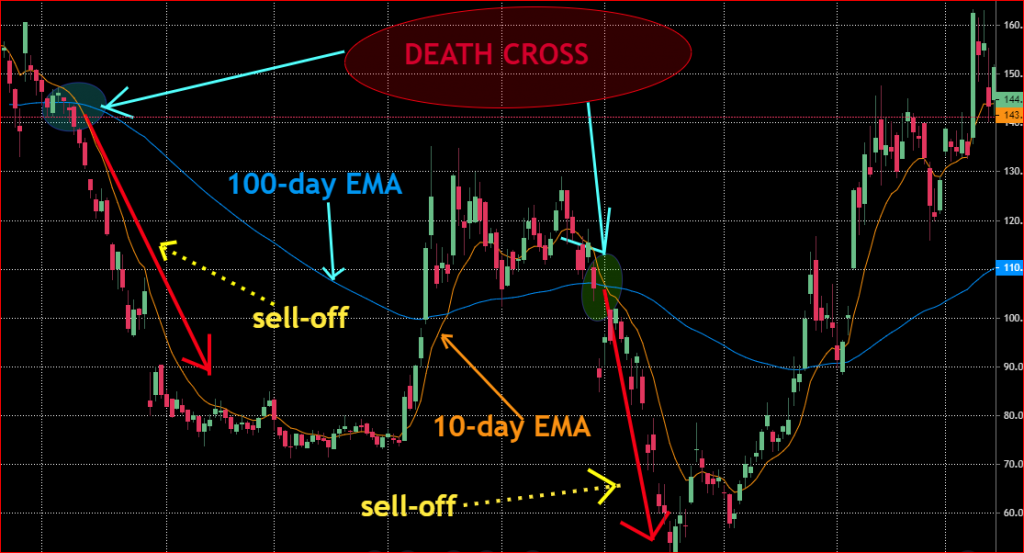
You can observe a death cross on Chart 2. depicted above.
Why does death cross matter?
Once a death cross occurs, there will be a sell-off (not all the time). Since this is a pattern and many traders use it, they will expect a major sell-off when the pattern happens. Some traders can start selling to lock in profits or short sell the stock in an anticipation of a downtrend.
This sell-off can accelerate the downtrend momentum in the price of the security.
For this reason, many traders use a death cross as a sell signal. As you can see in Chart 2 depicted above, there were major sell-offs whenever the long term moving average crossed above the short term moving average.
You should always understand that every death cross does not turn into a major sell-off. Everything depends on investors’ sentiments about the stock and market conditions.
News related to the stock or its sector can influence where the stock goes after a death cross.
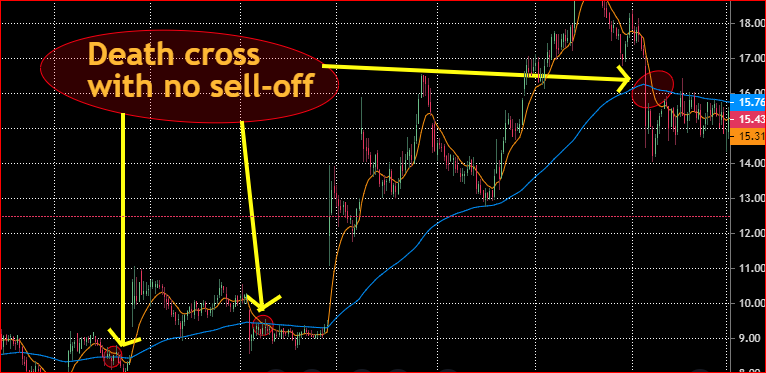
As seen in Chart 3 shown above, there are some death crosses that did not turn into a major sell-off.
Final words
Dead crosses can be a great trading pattern for people who know what they are doing. It can be a selling signal or a trap.
Therefore, if you are using this strategy make sure that you fully understand it. In addition, use other trading indicators to help you confirm your trading decision about the death cross.
You should always use loss prevention methods such as stop-loss order, limit orders, trailing stop, or stop-limit orders, etc in case the price moves against you.
Happy trading and investing !