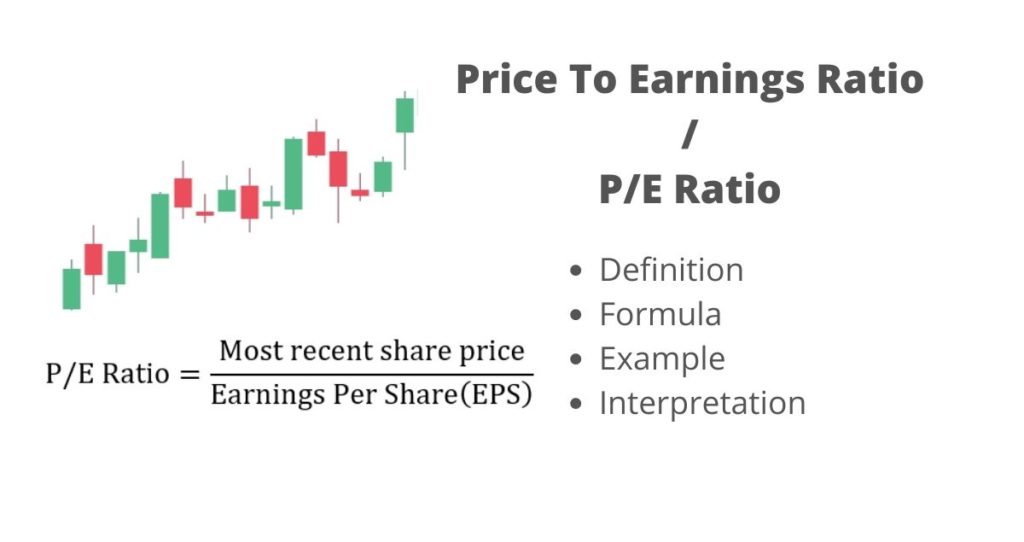
What is P/E ratio?
The price to earnings ratio a.k.a P/E ratio is a financial ratio that compares the company’s share price with its earnings per share(EPS), according to SmartAsset. In other words, the P/E ratio shows investors how much they must pay for every dollar of the company’s earnings. Investors and traders use this ratio to assess the company’s valuation (overvalued or undervalued).
How to calculate PE ratio?
The P/E ratio is calculated by dividing the company’s share price by its earnings per share. The earnings per share will be reported on the income statement whereas the share price will be the current stock price of a company.
In this formula,
EPS = (Net profit)/(Number of shares outstanding)
Example of P/E ratio and interpretation
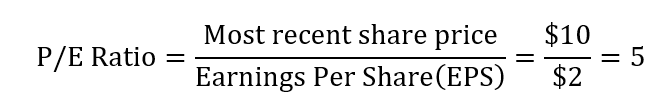
Let’s assume that XYZ company reported an EPS of $2 on its income statement. If the company is currently trading at $10 per share, we can calculate the price to earnings ratio as follow.
What does our result mean?
From the example above, you can see that the company XYZ has a P/E ratio of 5. In other words, investors pay $5 for every $1 of earnings the company generates.
The price to earnings ratio can be used to figure out if investors are paying a fair price on its shares. If the ratio is high, it will indicate that the company is overvalued and investors are willing to pay a lot of money to own its shares. This usually happens when investors are optimistic about the future earnings of the company.
That is as long as the company has good management and a lot of promising products under development that will bring in a lot of revenues; investors will buy the stock based on its future value regardless of the current EPS.
On the other hand, a low P/E ratio indicates that a company is undervalued, its revenues are going down, or expected to decline. Hence, signaling more troubles in the future.
Furthermore, investors use the P/E ratio to compare a company’s earnings with its sector. If the ratio is lower than the industry’s average, it will indicate investors’ pessimistic sentiments about the company and its shares.
More learning resources
- Quick Ratio: What Is Quick Ratio?
- Debt To Income Ratio (DTI): What Is DTI?
- Current Ratio: What Is The Current Ratio?
- Debt To Equity Ratio Or Debt-Equity(D/E) Ratio
- Profit Margin Basics And Definition
- Inventory Turnover Ratio
- Price-To-Sales (P/S) Ratio: What Is P/S Ratio?
- Price-To-Book (P/B) Ratio: What Is P/B Ratio?
- Asset Turnover Ratio? How Does It Work?
- Dividend Payout Ratio And How It Works