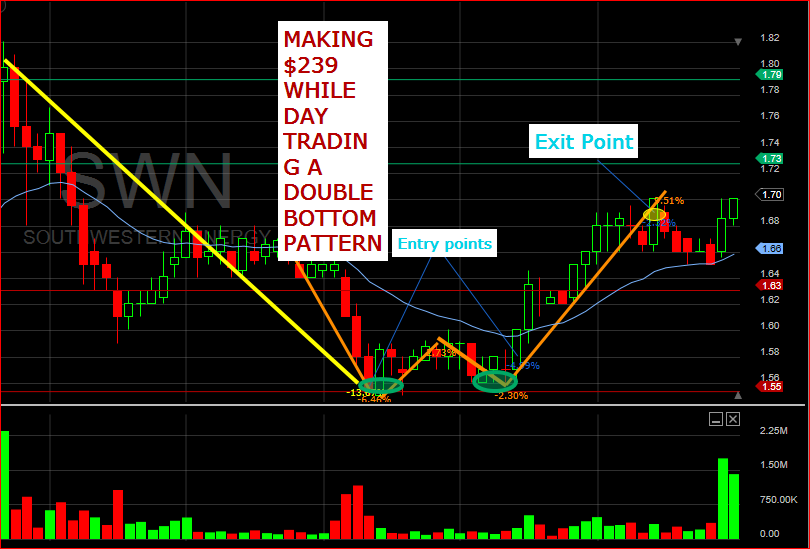
We have seen in detail how the double bottom pattern works and how to trade it whether you are going long or short. In this post, I am going to explain how I used a double bottom pattern to make $239 while day trading.
The stock I traded is SWN. I did not even trade it in the morning as some traders recommend. I only waited for the pattern to form and took a position in the stock.
Table of Contents
- Formation of the pattern
- Entry levels
- First resistance
- Getting out of my position
- Profit or loss made
- The bottom line
1. Formation of the pattern
Support and resistance level are shown in figure 1. below.
The support levels are indicated by the red lines whereas the resistance levels are indicated by the green lines.
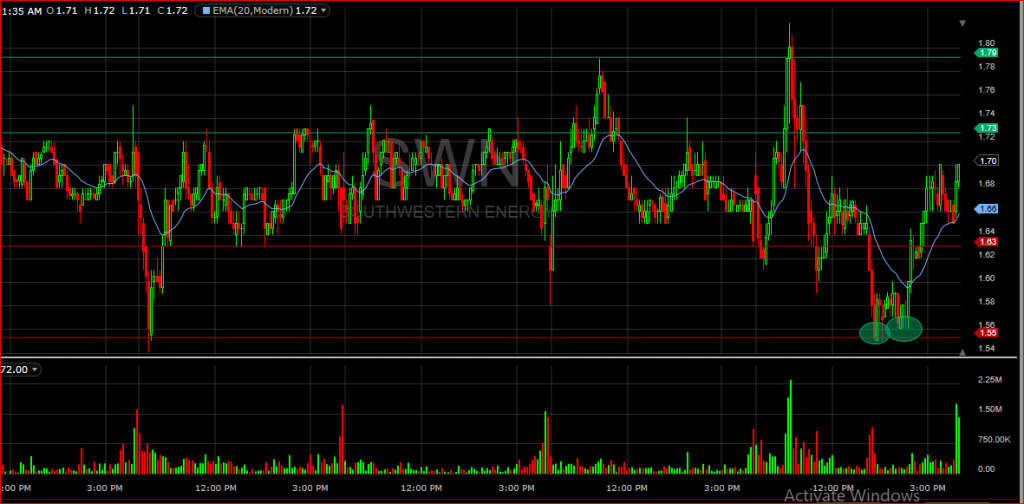
From the figure above, you can see that the stock has been bouncing between $1.62 and $1.75 for a few days. The lowest and highest levels reached are around $1.55 and $1.82. These levels mark our support and resistance levels in the short term.
In my trade, I knew the stock will continue a downtrend if it breaks the $1.62 support line. The next stop was going to be our next support level which is at $1.55. That is what happened.
As we explained in our double bottom pattern post, I needed a confirmation that the stock was going back up since I wanted to go long. After I got my confirmation, I started trading the stock.
2. Entry levels
I first bought 1000 shares of SWN at 1.5558/share to test the bottom (it is not recommended to test the bottom, I just wanted to do it). From there, I waited to see what the stock does on the support area. Please check, figure 2 below.

The double bottom pattern was formed as expected and the support was rejected. Keep in mind that the stock was down 14% from its previous high of $1.82. It was inevitable that the stock was going to form a double bottom pattern or go back up without forming a double bottom after it reaches our support level.


After I got an upward trend confirmation, I took the second position of 1000 shares at 1.59/share. At this point, I had all shares I needed. What did I do next? I waited.


We advised you to use stop loss for every trade you make. In my trade, I put a stop loss at $1.53.
3. First resistance
You can see that we have two support levels. After it rejected the first support level at $1.55, the second support became the resistance. Usually stock consolidates at resistance and support levels. You can see that our stock consolidated on the first resistance level of $1.63.
I had 2 choices at this point. If the stock rejected this resistance level, it was going to be an indication of a downtrend.
I would get out of my positions as soon as I get a confirmation. On the other side, if the stock broke the resistance level and continued an upward trend, I would stay in and cash out at the next resistance level or close to it.
4. Getting out of my position
After our stock reached the $1.68 level, it started consolidating and looked like some forks were taking profits. Keep in mind that this level forms a short-term resistance. It was obvious that the stock was either going to continue its upward trend or reverse into a downtrend.
Another contributing factor is that it was late and the market was about to close. Therefore, the stock could reverse as people take profit before the market closes.


5. Profit or loss made
I bought 1000 shares at $1.5558/share and 1000 at $1.59/shares. This is a total of 2000 shares of SWN bought with $3145.8 on an average cost of $1.5729/share. From Figure 5, you can see that I sold all 2000 shares of SWN at $1.6925/share.
This brings in a total of $3385. If you do some math, you can see that the difference between the money I spent and my total return on the trade is $239.2. The commission in this case in zero since many brokerage firms canceled commission fees.
6. The bottom line
The double bottom pattern works for sure. However, if you decide to trade using this pattern, you must first learn how it works and risks involved with it.
We are not financial advisers, certified financial coaches, or offer any investment advice to our readers and followers. Therefore, any material you learn from our website should not be considered as an official investment guide. For this reason, we are NOT liable for any investment decision you make.
We recommend that you consult with your investment adviser, coach, etc. to guide you before you make any investment decisions.
Always invest with the money you can afford to lose and use stop losses to protect you in case the market goes against you.
